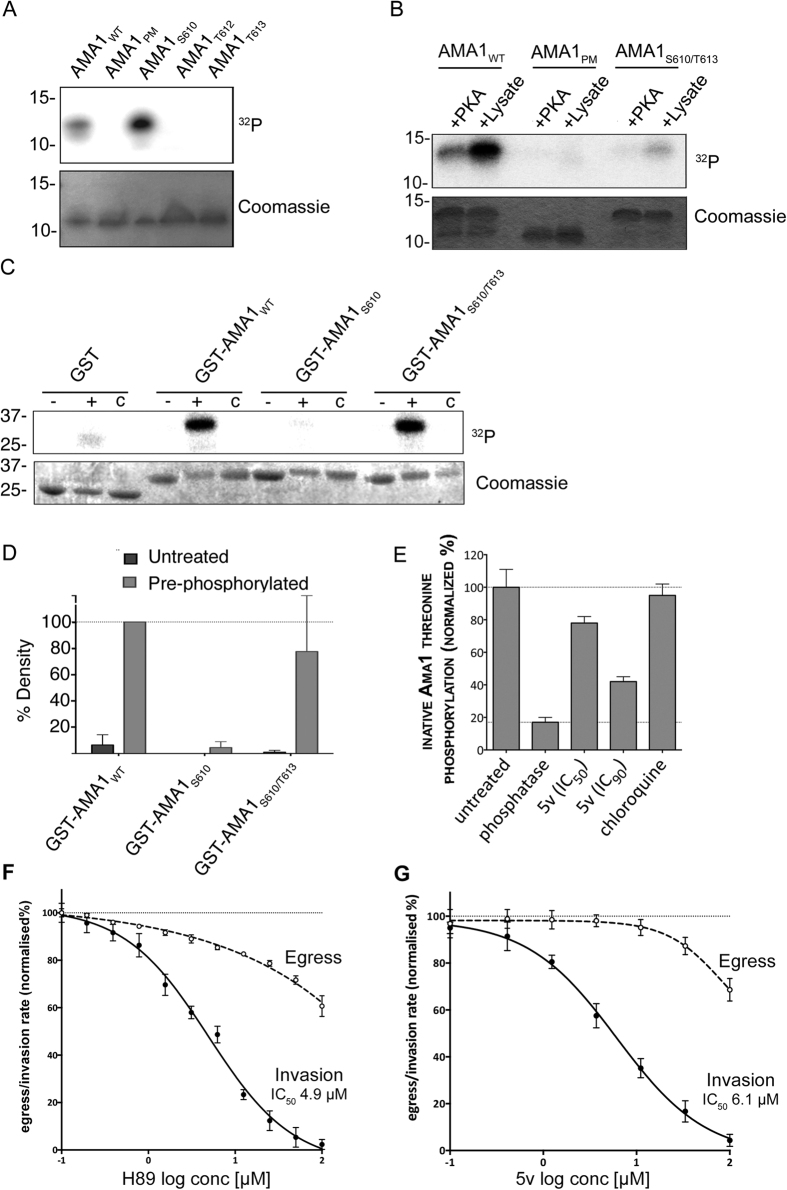
Figure 4. S610 phosphorylation is a prerequisite for efficient T613 is phosphorylation.
(A) Autoradiograph of in vitro phosphorylation samples (upper panel) as well as coomassie stained loading (lower panel) are shown. AMA1 variants displaying either all (AMA1WT), none (AMA1PM) or only single phosphorylation sites (AMA1S610, AMA1T612, AMA1T613) were incubated with schizont material in the presence of cAMP and 32P-γ-ATP. (B) Phosphorylation of PKA pre-phosphorylated AMA1WT and mutants AMA1PM and AMA1S610/T613. Recombinant proteins were first incubated with PKA in the presence of non-labeled ATP. Subsequently, these pre-treated AMA1 were incubated with either PKA or a schizont extract in the presence of 32P-γ-ATP. AMA1PM was used as a control. SDS-PAGE and radiograph of in vitro phosphorylation samples (upper panel) as well as coomassie stained loading (lower panel) are shown. (C) In vitro phosphorylation of AMA1-GST fusion variants (AMA1WT, AMA1S610, AMA1S610/T613) either as unphosphorylated (-) or PKA-pre-phosphorylated (+) substrates in the presence of recombinant PfGSK3β and 32P-γ-ATP or without the addition of PfGSK3β (c). (D) Signal intensities were quantified. Error bars correspond to standard deviation of two independent experiments done in triplicates. (E) Sandwich ELISA demonstrating 5v-induced inhibition of native AMA1 threonine phosphorylation. Parasites were treated with 5v and a rabbit anti-PfAMA1 antibody was used to capture PfAMA1 from culture lysates. Threonine phosphorylation was detected in an ELISA format using a mouse anti-phosphothreonine antibody. Histograms were generated after normalizing against uninfected (0%, background) and untreated (100%) culture signals. Phosphatase-treatment was used to denote zero phosphorylation and chloroquine treatment was used to exclude parasite growth arrest as a cause for reduced phosphorylation. (F) The PfPKA inhibitor H89, weakly inhibited egress and strongly inhibited invasion in P. falciparum reporter parasites transfected with secreted Nanoluciferase. Luciferase activity in relative light units was measured and dose-response curves were plotted for egress (dashed line) and invasion (solid line) after normalizing against uninfected (0%) and untreated (100%) culture sample signals. Two biological replicates were performed in triplicate; error bars denote one standard deviation. (G) The PfGSK inhibitor 5v strongly inhibits invasion. The experiment was performed as per F.

