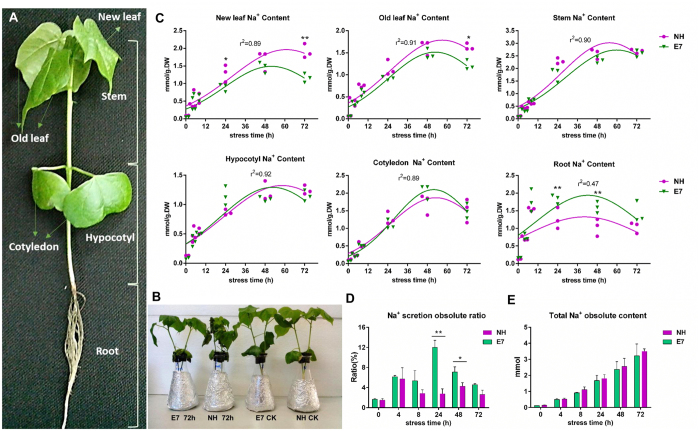
Figure 2. Na+ content in the NH and E7 genotypes after NaCl shock at different time points and in different tissues.
(A) Cotton seedlings were divided into 6 different tissue types and used to measure the relative content of Na+ and K+. (B) Visual appearance of NH and E7 seedlings after 72 h with and without 200 mM NaCl treatment. (C) Accumulation of Na+ in six NH and E7 tissue types with 200 mM NaCl shock over 72 h. Each symbol represents one biological repeat. (D) The percentage of Na+ secreted as a proportion of the total Na+ content in the whole plant between the two genotypes. The results are the means ± standard errors of three biological replicates. (E) The total Na+ content in the whole plant between the two genotypes. Single (*) and double (**) asterisks indicate significant differences (P < 0.05, one-way ANOVA).

