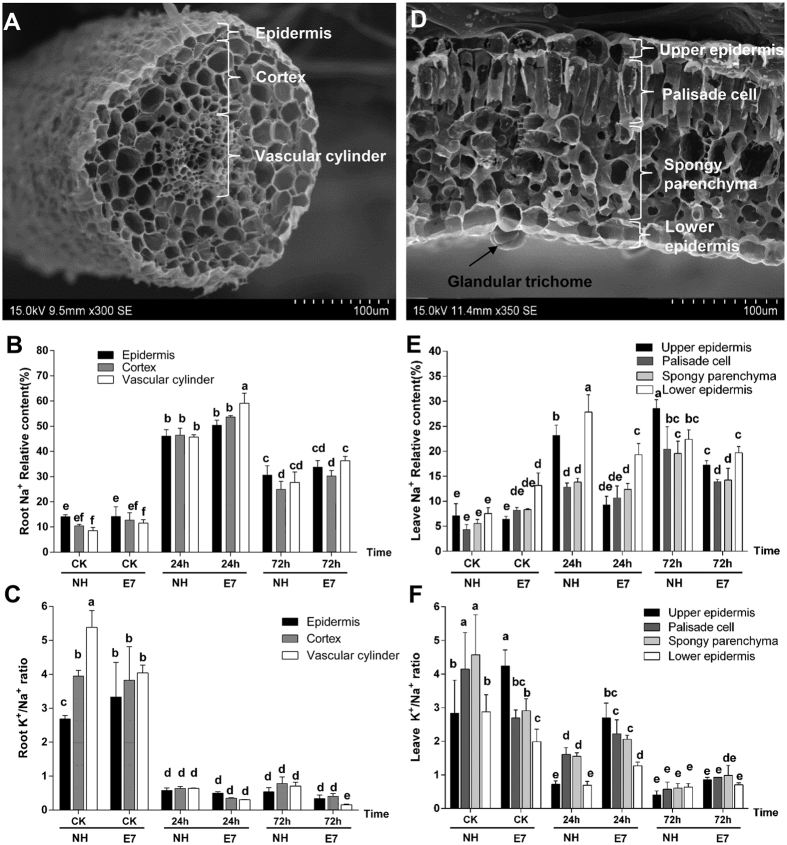
Figure 3. Na+ content in NH and E7 after NaCl shock at different time points and in different cells of the roots and leaves.
Scanning electron micrographs of the three root cell types with a map scan from the X-ray microanalysis (A). The percentages of Na+ (B) and the K+/Na+ ratios (C) in the epidermis, cortex, and vascular cylinder sections of the roots of G. hirsutum seedlings exposed to 200 mM NaCl for 72 h. (D) Scanning electron micrographs of the four leaf cell types with a map scan from the X-ray microanalysis. The percentages of Na+ (E) and the K+/Na+ ratios (F) in the upper epidermis, palisade cell, spongy parenchyma, and lower epidermis sections of leaves of G. hirsutum seedlings exposed to 200 mM NaCl for 72 h. The data are the means of 5–8 measurements. The same letter on the bar diagram represents no significant difference (P = 0.05), as determined by the one-way ANOVA. X-ray microanalysis was used to detect the ratios of elements in the roots and leaves. The results were expressed as the percentages of the atomic numbers for particular elements (Na+ or K+) in the total atomic number for all of the elements (Na+, K+, Ca2+, and Cl−) measured in a given region.

