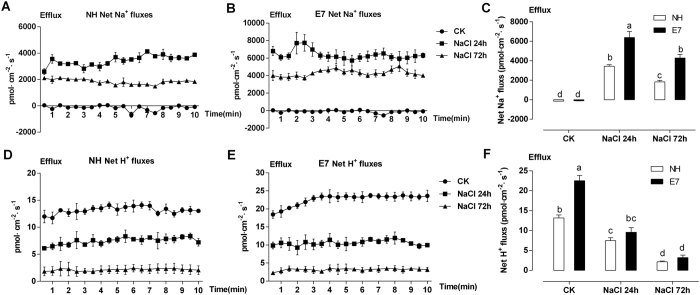
Figure 5. Net Na+ and H+ fluxes in mesophyll cells of the second true leaves.
NH (A,D) and E7 (B,E) fluxes under 0 and 200 mM NaCl shock for 24 and 72 h. The Na+ and H+ fluxes were measured immediately after the mesophyll cells were sampled. Each point is the mean of 4–6 individual plants. The bars represent the standard errors of the mean. Panels C and F show the mean flux rates of Na+ and H+ from 0 to 10 min after the onset of salt shock, which lasted for 24 and 72 h, respectively. Columns labelled with different letters indicate significant differences at P < 0.05.

