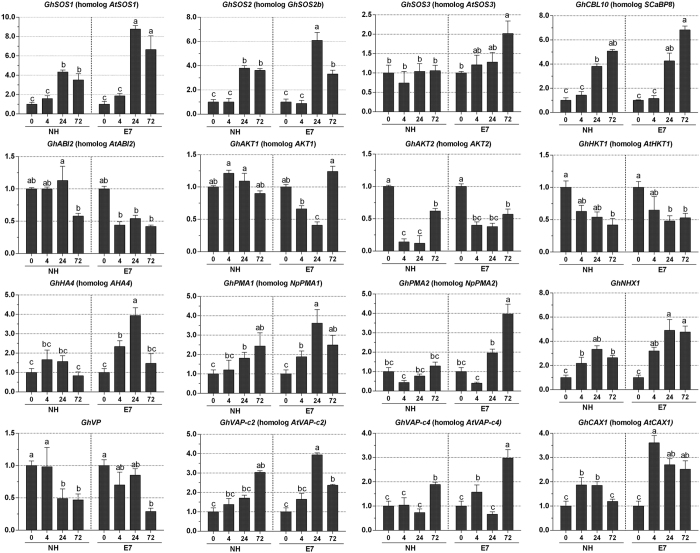
Figure 7. Expression patterns of genes related to salt tolerance in cotton.
Gene expression of NH and E7 leaves was compared by qRT-PCR after 0, 4, 24 and 72 h of treatment with NaCl shock. The error bars indicate standard deviations from nine repeats (three biological × three technical repeats). Selected genes encoding pH regulators (PM- and V-ATPase), SOS pathway-related proteins (SOS1, SOS2, SOS3, and ABI2), K+ transporters (HKT1 and AKT1), and membrane trafficking-related proteins (NHX1) are shown. capital letters indicate significant differences at the 0.05 level.

