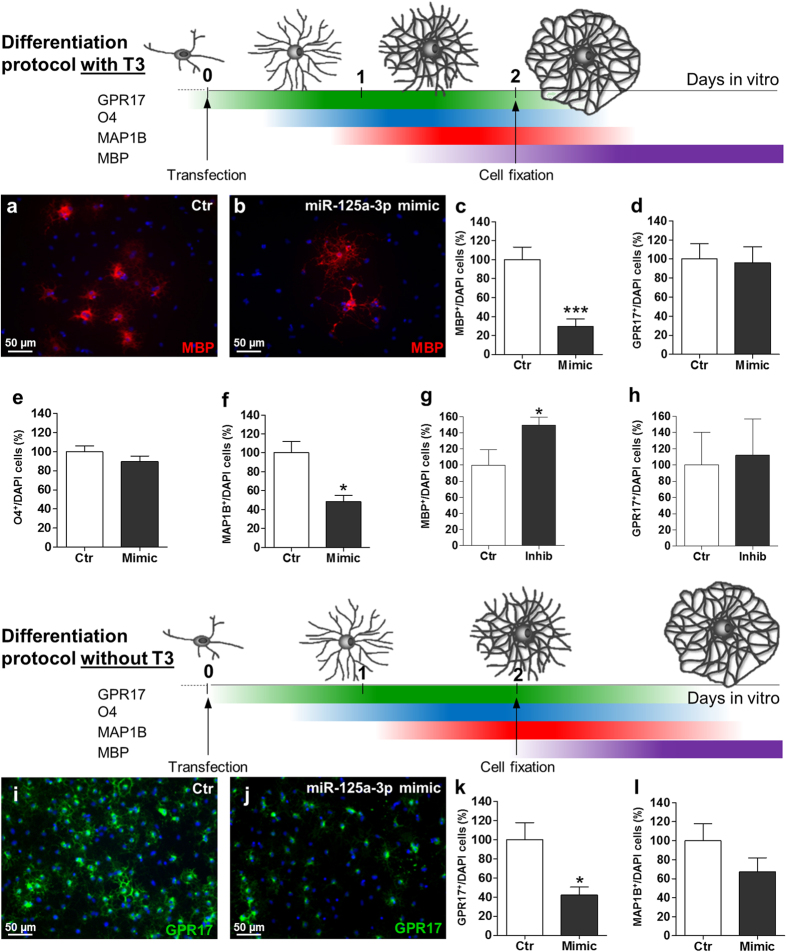
Figure 3. Effect of over-expression or inhibition of miR-125a-3p during oligodendroglial differentiation.
To evaluate the time-dependent effects of either the overexpression or the silencing of miR-125a-3p on OPC maturation 4 different markers of progressive differentiation stages were analysed by immunocytochemistry, GPR17 and O4 (which label pre-oligodendrocytes), MAP1B (which labels a slight more advanced stage) and MBP (which labels terminally differentiated cells). Cells were stained for the selected markers 48 h after transfection of miR-125a-3p mimic or inhibitor, in the presence or in the absence of the T3 hormone. (a–h) The drawing represents a schematic timeline of the fast differentiation protocol in the presence of T3, showing the presented markers. (a,b) Representative micrographs of MBP+ oligodendrocytes after transfection of miR-125a-3p mimic in presence of T3 were shown. (c–f) Histograms show the changes in the number of cells positive for MBP (n = 10), GPR17 (n = 8), O4 (n = 2) and MAP1B (n = 3) with respect to negative controls. Data were expressed as mean ± SEM, two-tailed unpaired t test *p < 0.05, ***p < 0.001 vs. negative control. (g,h) Transfection of OPC with the inhibitor of miR-125a-3p (in presence of T3) led to a significant increase in the number of MBP+ (n = 4; p-value = 0.0376), but not GPR17+ (n = 7) cells. Data were expressed as mean ± SEM, two-tailed unpaired t test *p < 0.05 vs. negative control. (i–l) A second differentiation protocol in the absence of T3 (slower protocol) was used. Also in this case, the drawing represents a schematic timeline showing the presented markers. (i,j) Representative micrographs of GPR17+ oligodendrocytes after transfection of miR-125a-3p mimic in absence of T3 were shown. (k,l) Histograms show a considerable decrease in the number of GPR17+ (n = 7) and MAP1B+ (n = 3) cells after transfection with the mimic in the absence of T3 with respect to the negative control. Data were expressed as mean ± SEM, two-tailed unpaired t test *p < 0.05 vs. negative control.

