
Fig. 1.
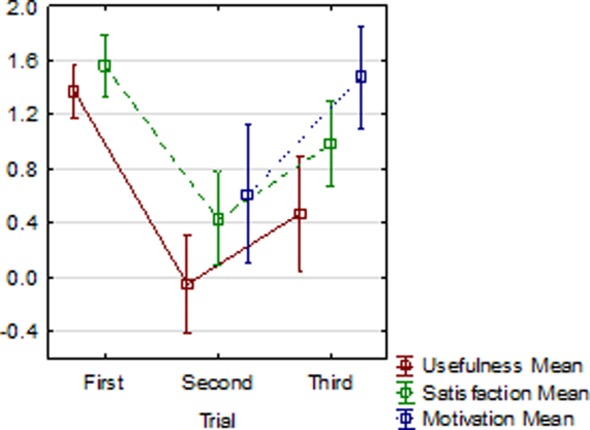
General averages of usefulness, satisfaction and motivation scales: seniors and caregivers combined. Vertical bars represent the standard error of the means. Scale range = [−3; 3]
Official websites use .gov
A
.gov website belongs to an official
government organization in the United States.
Secure .gov websites use HTTPS
A lock (
) or https:// means you've safely
connected to the .gov website. Share sensitive
information only on official, secure websites.
General averages of usefulness, satisfaction and motivation scales: seniors and caregivers combined. Vertical bars represent the standard error of the means. Scale range = [−3; 3]