
Figure 2. Abundance of centrosomal proteins in whole‐cell lysates and purified centrosomes.
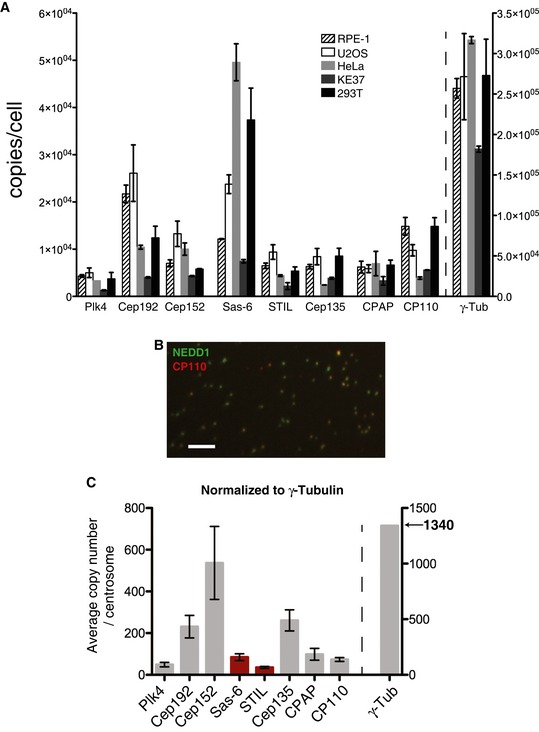
- The absolute abundance of centrosomal proteins in whole‐cell lysates, prepared from asynchronous growing cells, was determined using SRM mass spectrometry combined with stable isotope dilution. Copy numbers per cell were measured in three independent experiments. Because not all peptides could be detected in all experiments, histograms show average values determined in those two measurements in which most peptides could be measured reliably. Results presented are means ± SEM. RPE‐1 (non‐transformed) cells were compared with various tumor‐derived (U2OS, HeLa, KE37) or transformed cells (HEK293T). Note the different scale for γ‐tubulin on the y‐axis.
- Representative image showing centrosome preparation stained with antibodies to NEDD1 (green) and CP110 (red). Scale bar: 10 μm.
- Purified centrosomes from KE37 cells were analyzed by SRM with stable isotope dilution. Histogram a priori represents relative copy numbers per centrosome (results presented are means ± SEM). To predict protein abundance in absolute numbers (average number of copies/centrosome), data were normalized to 1,340 γ‐tubulin molecules, that is the average number of γ‐tubulin per centrosome as deduced by combining SRM and EGFP fluorescence measurements (Figs 4 and 5). Bars for Sas‐6 and STIL are marked in red to indicate that the corresponding values should be approximately doubled to correct for the fact that some 50% of purified centrosomes are derived from G1‐phase cells that mostly lack these two proteins. Note the different scale for γ‐tubulin on the y‐axis.