
Figure 3. Label‐free quantification of centrosome preparations.
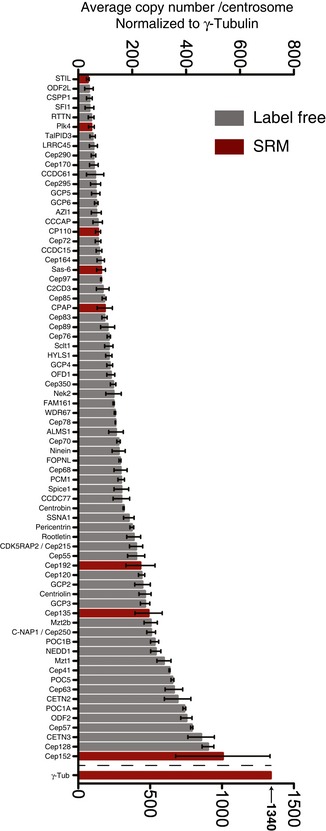
Centrosome preparations from KE37 cells were analyzed by shotgun proteomics and relative protein abundances determined using the iBAQ shotgun proteomics method. The iBAQ values were normalized with the trendline as obtained from the SRM measurements (Fig EV1E), and γ‐tubulin was normalized to 1,340 copies/centrosome. A subset of centrosomal proteins is shown as described in Azimzadeh et al (2012). Black bars represent the centrosome subset, and red bars represent the values obtained by SRM. Results presented are means ± SEM.