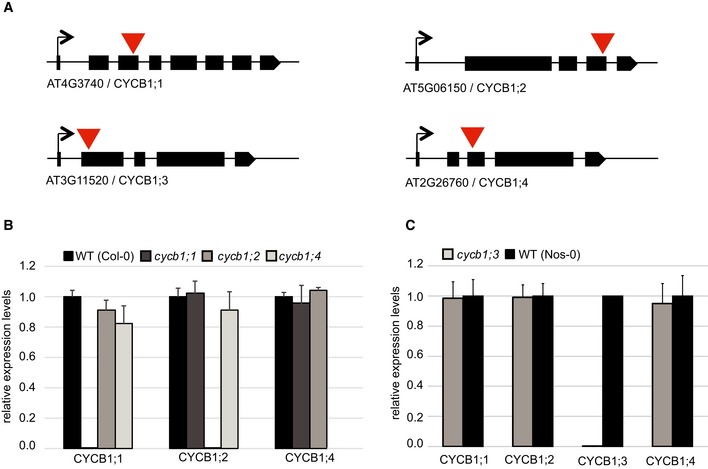
Figure EV1. T‐DNA insertion mutants of the Arabidopsis thaliana CYCB1 genes.

- Schematic overview of T‐DNA insertions for cycb1;1, cycb1;2, cycb1;3, and cycb1;4. Black boxes display exons, and red arrowheads indicate the positions of the T‐DNA insertion.
- Quantitative PCR for relative expression levels in the wild type (Col‐0), cycb1;1, cycb1;2 and cycb1;4. EXP, SAND, and ACT7 were used as reference genes for normalization. Each value represents the mean ± standard deviation of three independent experiments.
- Quantitative PCR for relative expression levels in the wild type (Nos‐0) and cycb1;3. EXP, SAND, and ACT7 were used as reference genes for normalization. Each value represents the mean ± standard deviation of three independent experiments.
