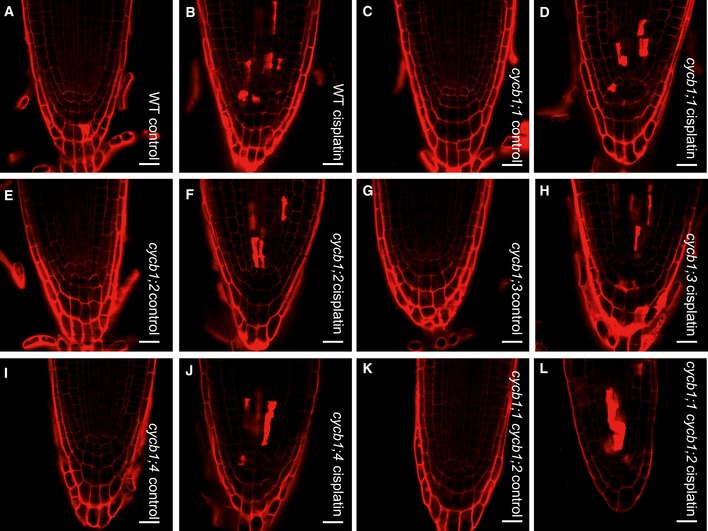
Figure EV4. Cell death in cycb1 mutants after cisplatin treatment.

-
A–LPropidium iodide staining of the apical root meristem in wild type grown on control plates (A) or plates supplemented with 50 μM cisplatin for 24 h (B); cycb1;1 grown on control plates (C) or plates supplemented with 50 μM cisplatin for 24 h (D); cycb1;2 grown on control plates (E) or plates supplemented with 50 μM cisplatin for 24 h (F); cycb1;3 grown on control plates (G) or plates supplemented with 50 μM cisplatin for 24 h (H); cycb1;4 grown on control plates (I) or plates supplemented with 50 μM cisplatin for 24 h (J); cycb1;1 cycb1;2 grown on control plates (K) or plates supplemented with 50 μM cisplatin for 24 h (L). Red spots show cell death. Scale bars: 20 μm.
