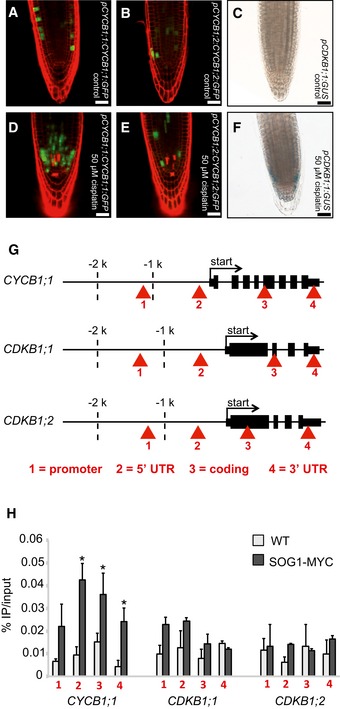
Transgenic Arabidopsis plants harboring the CYCB1;1 promoter and a GFP fused to the N‐terminal part of CYCB1;1 including the destruction box grown on control plates and imaged 5 days after germination.
Transgenic Arabidopsis plants harboring the CYCB1;2 promoter and a GFP fused to the N‐terminal part of CYCB1;2 including the destruction box grown on control plates and imaged 5 days after germination.
Transgenic Arabidopsis plants harboring CDKB1;1 promoter fused to GUS grown on control plates and were stained and imaged 5 days after germination.
Transgenic Arabidopsis plants harboring the CYCB1;1 promoter and a GFP fused to the N‐terminal part of CYCB1;1 including the destruction box germinated on control plates and were transferred 4 days after germination to plates supplemented with 50 μM cisplatin and were imaged 24 h after drug application.
Transgenic Arabidopsis plants harboring the CYCB1;2 promoter and a GFP fused to the N‐terminal part of CYCB1;2 including the destruction box germinated on control plates and were transferred 4 days after germination to plates supplemented with 50 μM cisplatin and were imaged 24 h after drug application.
Transgenic Arabidopsis plants harboring CDKB1;1 promoter fused to GUS germinated on control plates and were transferred 4 days after germination on plates supplemented with 50 μM cisplatin and were stained and imaged 24 h after drug application.
Structure of genes tested by ChIP with an anti‐MYC antibody in PRO
SOG1
: SOG1‐Myc and wild‐type plants. A total of four regions were tested as indicated by arrowheads. Asterisks indicate significant differences within a 5% confidence interval (Student's t‐test).
Chromatin immunoprecipitation (ChIP) of wild‐type plants and PRO
SOG1
: SOG1‐Myc lines and anti‐MYC antibody. The promoter region of CYCB1;1 is enriched in SOG1‐Myc after cisplatin treatment. Red arrowheads indicate the primer binding sites for PCR.
Data information: Scale bars: 20 μm. Three biological and three technical replicates were performed. Graphs represent mean ± SD.

