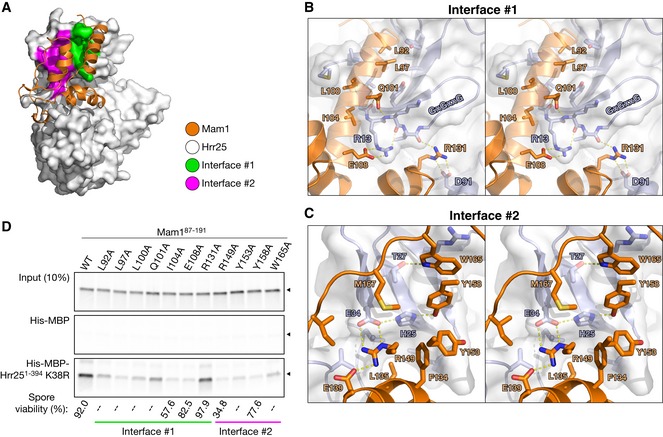
Figure 5. Two interfaces in the Hrr25:Mam1 complex.

- The Hrr25:Mam1 complex with Mam1 shown as orange ribbons, and Hrr25 shown as a white surface with Mam1‐binding interface #1 shown in green and #2 in magenta.
- Stereo view of interface #1, which involves hydrophobic interactions by Mam1 L92, L97, L100, and I104, and a hydrogen‐bond network between Mam1 Q101/E108/R131 and Hrr25 residues 12–15.
- Stereo view of interface #2. Hrr25 residues H25 and E34 participate in a buried hydrogen‐bond network with Mam1 residues R149 and Y158 and are surrounded by hydrophobic residues on both proteins. For clarity, Mam1 helix α4, on which R149, Y153, and Y158 are located, is not shown.
- Pull‐down assay with in vitro‐translated Mam187–191 (wild‐type and alanine mutants) and Hrr251–394 K38R. Mam1 mutations also disrupt Hrr25 binding when the two are co‐expressed in Escherichia coli (Fig EV6B). Bottom: Spore viability of MAM1 mutant strains (see Table EV2 for strains; strains tested are KC549, KC560, KC566, KC552, KC554, KC556, and KC558; 46–48 tetrads were dissected for each strain). “–” indicates that this mutation was not tested for spore viability.
