
Figure EV4. α‐synuclein fibrils are partially internalized in a dynamin‐dependent manner.
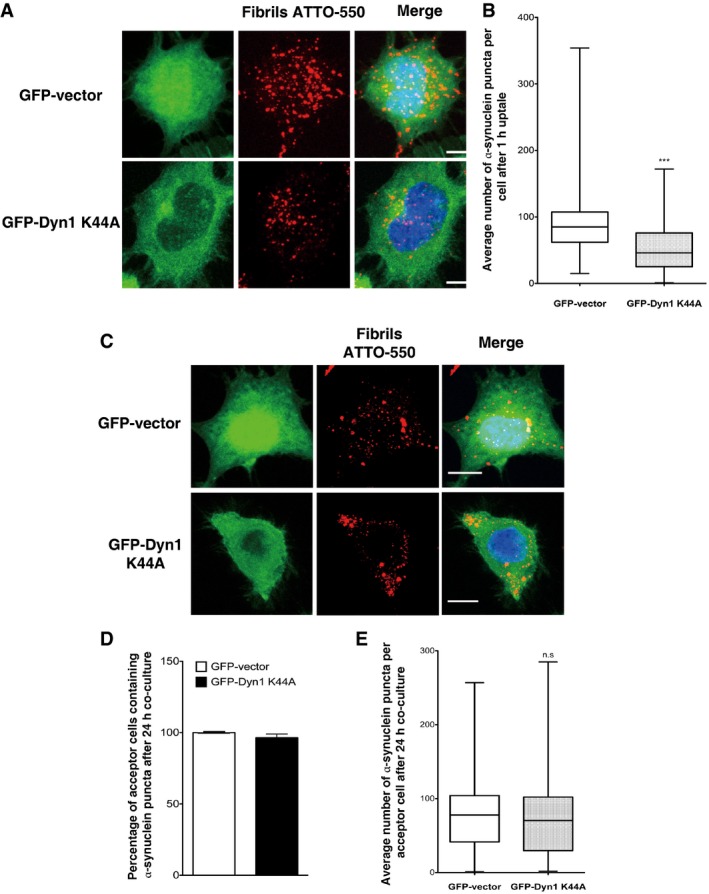
- Representative images of GFP vector (upper panel) or GFP‐dynamin‐1 K44A‐transfected cells (bottom panel) challenged for 1 h with ATTO‐550 α‐synuclein fibrils, trypsin‐washed and then fixed: in red, α‐synuclein fibrils; in green, GFP vector or GFP‐dynamin‐1 K44A‐transfected cells; and in blue, nuclei. Scale bars represent 5 μm. n = 3 independent experiments.
- Quantification of the average number of α‐synuclein fibrils per cell obtained from experiments in (A) shows a significant decrease in the number of α‐synuclein fibrils in dynamin dominant‐negative cells (GFP‐Dyn1 K44A) compared to control cells (GFP vector) indicating a partial dynamin‐dependent mechanism of α‐synuclein fibril uptake in neuron‐like cells (***P < 0.001 by two‐tailed Mann–Whitney U‐test). n = 3 independent experiments.
- Representative images of GFP vector (upper panel) or GFP‐dynamin‐1 K44A‐transfected acceptor cells (bottom panel) after 24‐h co‐culture with donor cells loaded with α‐synuclein fibrils: in red, α‐synuclein fibrils; in green, GFP vector or GFP‐dynamin‐1 K44A‐transfected acceptor cell; and in blue, nuclei. Scale bars represent 10 μm. n = 3 independent experiments.
- Relative percentage of acceptor cells containing α‐synuclein fibrils after co‐culture as in (C) revealed that transfer of α‐synuclein fibrils does not depend on dynamin‐1. Data are shown as mean ± s.e.m. (n.s. with GFP vector raw percentage set to 100%, not significant by Student's t‐test).
- Quantification of the average number of α‐synuclein fibrils per acceptor cells after co‐culture as in (C) showing no significant difference in the number of α‐synuclein fibrils in acceptor cells in control (GFP vector) and dynamin dominant‐negative (GFP‐Dyn1 K44A) conditions. Data are shown as mean ± s.e.m. of three independent experiments (n.s., not significant by two‐tailed Mann–Whitney U‐test).
Data information: In the box and whisker plots shown in (B and E), boxes extend from the first to the third quartile, the line inside the boxes shows the median and the whiskers represent the min/max value of at least 100 cells scored for each experiment.