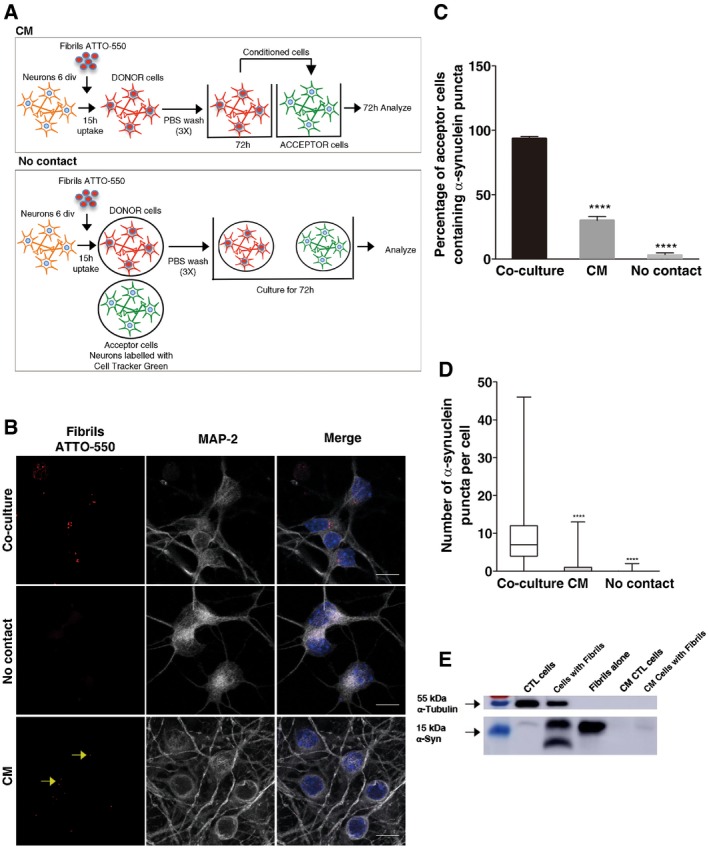
Experimental set‐up used to assay transfer through conditioned medium (upper scheme) and cell‐to‐cell contacts (lower scheme) in neurons. For the CM experiments, donor neurons are loaded with α‐synuclein fibrils for 16 h, washed 3 times with PBS, and then fresh medium is added and left to condition for 72 h. CM is then collected and transferred to acceptor neurons (10 div) for 72 h. In the cell‐to‐cell contact impairment (No contact) experiment, the donor (already loaded) and newly dissected acceptor (already labelled) neurons are plated on different coverslips placed in the same Petri dish. In both experiments, the percentage of cells containing α‐synuclein ATTO‐550 puncta, and the number and mean size of α‐synuclein puncta per cell are quantified using the ICY software after 72 h.
Representative images of acceptor neurons that were either (i) co‐cultured with donor neurons (upper panel, Co‐culture), (ii) physically separated from donor cells (middle panel, No contact) or (iii) cultured with the conditioned medium of donor neurons (bottom panel, CM). In red, α‐synuclein fibrils; in white, acceptor neurons; and in blue, nuclei. Scale bars represent 10 μm. Yellow arrows point to ATTO‐550 α‐synuclein puncta detected in the CM condition.
The bar graph shows the percentage of acceptor cells containing α‐synuclein puncta from images such as those presented in (B). ****P < 0.001 compared to the co‐culture condition by two‐tailed Student's t‐test. Data are shown as mean ± s.e.m. from three independent experiments (where at least 80 cells were counted per experiment).
The box plot shows the number of α‐synuclein puncta in acceptor neurons in co‐culture (white), in CM (grey) and in the No contact condition (light grey). Boxes extend from the first to the third quartile, the line inside the boxes shows the median and the whiskers represent the min/max value of at least 80 cells scored for each independent experiment. ****P < 0.001 compared to the co‐culture condition by two‐tailed Mann–Whitney U‐test (n = 3 independent experiments).
Western blot analysis of α‐synuclein indicates the presence of some α‐synuclein in the CM of neurons loaded with the fibrils after 72 h compared to control medium and to lysate of cells directly exposed to the fibrils. α‐tubulin was used as a loading control.