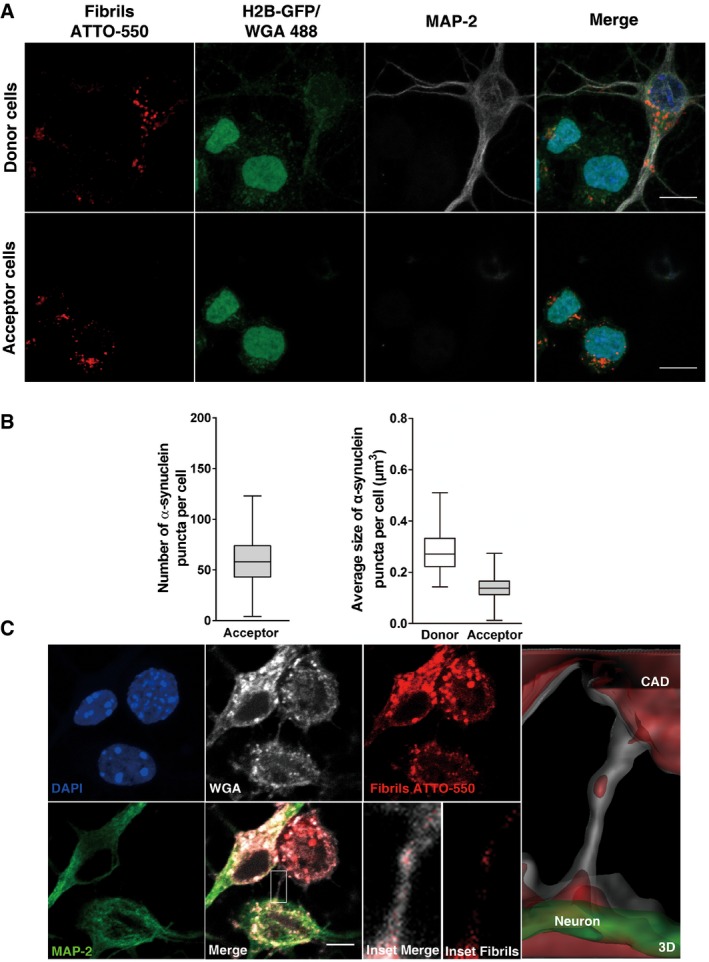
Representative images of donor (upper panel) and acceptor cells (bottom panel) after 24 h of co‐culture. Donor neurons were loaded with α‐synuclein fibrils prior to co‐culture with H2B‐GFP acceptor CAD cells. In red, α‐synuclein puncta; in green, acceptor CAD cells; in white, donor neurons; and in blue, nuclei. The images of donor cells are representative Z‐stack projections of the lower slices where these cells are located, and the images corresponding to acceptor CAD cells are Z‐stack projections of the upper slices, covering the whole cell body. Scale bars represent 10 μm.
Box plots showing the number (left side) and average size (right side) of α‐synuclein puncta in acceptor CAD cells after 24 h of co‐culture with donor neurons. (n=3 independent experiments). In the box and whisker plots, boxes extend from the first to the third quartile, the line inside the boxes shows the median and the whiskers represent the min/max value of at least 80 cells scored for each independent experiment.
Representative images showing a TNT detected between CAD cells and neurons after 24 h of co‐culture. In green, MAP‐2; in white, WGA; in red, α‐synuclein puncta; and in blue, nuclei. The merged image in the bottom panel shows in detail the TNT connecting the cells. The insets and the 3D reconstruction of the neuron (green) and the CAD cell (white) show the presence of α‐synuclein puncta inside the TNT. Scale bar represents 5 μm.