
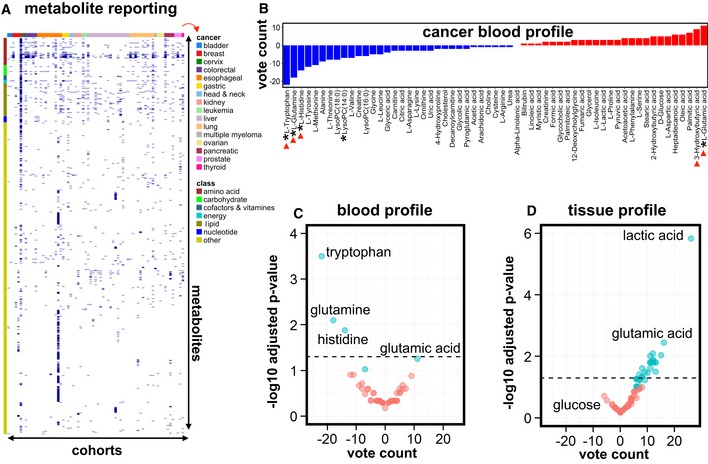
Figure 2. Metabolite reporting & vote‐counting analysis in tissue and blood.
-
AHeat map of all reported cancer blood metabolites (each dark blue mark denotes that the metabolite was reported to be increased or decreased) in various cancer types, illustrating that most individual studies report only a small subset of all previously measured metabolites. It is typically not described whether the metabolites that were not reported (white “empty” space) were not measured, or measured but not reported. Labeling: x‐axis (top): ribbon color code, denoting the cancer type (right; indicated by red arrow); x‐axis (bottom): cohorts, arranged from 1 to 71; y‐axis (right): all 1,206 metabolites reported in at least one of the studies; y‐axis (left): ribbon color code, denoting the metabolite class (amino acids, carbohydrates, etc.; “other” refers to all other metabolites than the listed classes). See also Table EV4.
-
BVote counting of cancer blood metabolites (reported in at least six cohorts) showed consistently deregulated metabolites. Blue bars: decreased metabolites; red bars: increased metabolites. An asterisk (*) in front of the name of the metabolite indicates at least a statistical trend (P < 0.1) obtained using the sign test; red arrowheads denote metabolites mentioned in the main text.
-
C, DVolcano plots of blood metabolites (C) and tissue metabolites (D), reported in at least six cancer studies, with the vote‐counting score on the x‐axis and the −log10 adjusted P‐value on the y‐axis. Cyan indicates deregulated metabolites that show a trend (P < 0.1; for blood, corresponding to metabolites marked with * in panel B; for tissue, corresponding to metabolites marked with * in Fig 3) or statistical significance (P < 0.05; above black dashed horizontal line); red indicates metabolites with a P‐value > 0.1. A subset of metabolites is annotated (see Tables EV4 (blood) and EV5 (tissue) for full annotation, vote‐counting statistics were calculated using the sign test).