-
A, B
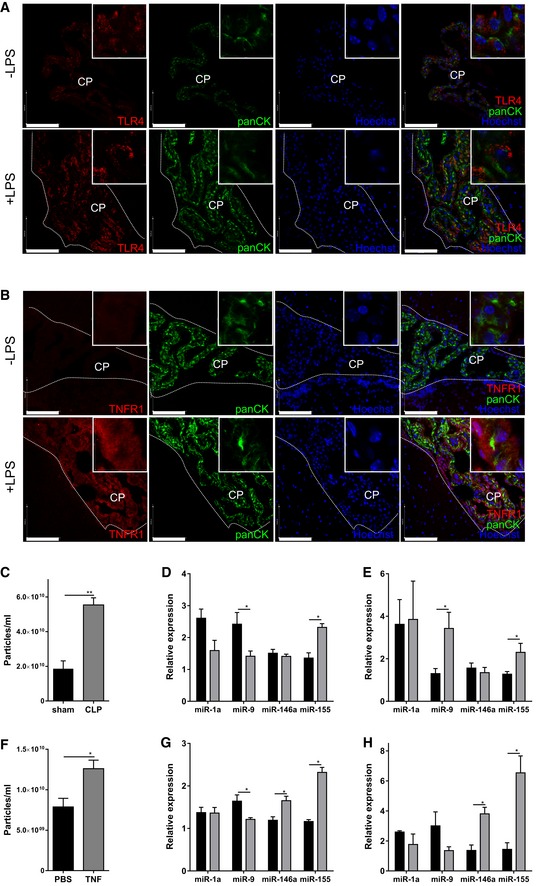
Representative confocal images of choroid plexus (CP) on brain sections from naive mice and 4 h after LPS injection (n = 3). Brain sections were stained for TLR4 (A) and TNFR1 (B) (red), pan‐cytokeratin (panCK, green), and the nuclei were stained with Hoechst (blue). The ependymal cells lining the ventricles are marked with a dotted line. Scale bars, 100 μm.
-
C
NanoSight analysis of EVs in the CSF in sham‐operated (black; n = 3) relative to CLP‐treated (gray; n = 4) mice 10 h after surgery (n = 4).
-
D
qPCR analysis of the expression of miR‐1a, miR‐9, miR‐146a, and miR‐155 in the choroid plexus of sham‐operated mice (black) and mice subjected to CLP (gray) 10 h after surgery (n = 5–7).
-
E
qPCR analysis of the expression of miR‐1a, miR‐9, miR‐146a, and miR‐155 in the CSF of sham‐operated mice (black) and mice subjected to CLP (gray) 10 h after surgery (n = 4–5).
-
F
NanoSight analysis of EVs in CSF of control (black; n = 5) and TNF‐injected (25 μg/20 g; gray; n = 4) mice 6 h after TNF challenge.
-
G
qPCR analysis of the expression of miR‐1a, miR‐9, miR‐146a, and miR‐155 in the choroid plexus of control mice (black) and in mice injected with TNF (gray) 6 h after injection (n = 5–7).
-
H
qPCR analysis of the expression of miR‐1a, miR‐9, miR‐146a and miR‐155 in the CSF of control mice (black) and on mice 6 h after TNF injection (gray) (n = 3).
Data information: Data in (C–H) are displayed as mean ± SEM and analyzed by Student's
‐test. Scale bar, 100 μm. Significance levels are indicated on the graphs: *0.01 ≤
< 0.01.