
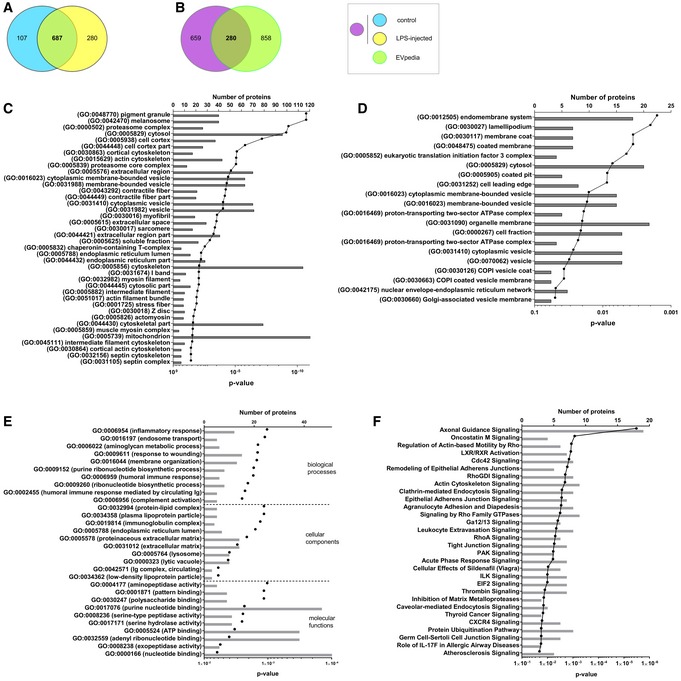
Figure 6. Proteome analysis of CPE‐derived EVs in the presence and absence of LPS .
-
AVenn diagrams showing overlap of proteins identified in EVs isolated from CSF of control (blue) and LPS‐injected (yellow) mice that were present in the two independent replicates.
-
BVenn diagrams showing overlap of the CSF EV proteome (control and LPS; purple) with the Mus musculus proteome list available on the EVpedia website (green).
-
CGO enrichment analysis using DAVID of the EV proteome compared with total choroid plexus proteome.
-
DGO enrichment analysis using DAVID of the EV proteome following LPS treatment compared with total choroid plexus proteome. The gray bars represent the number of proteins and the black dots the P‐values.
-
E, FDAVID (E) and Ingenuity pathway analysis (IPA) (F) on the CSF‐derived EV proteome, taking into account all proteins that are exclusively detected after LPS stimulation in both replicates.