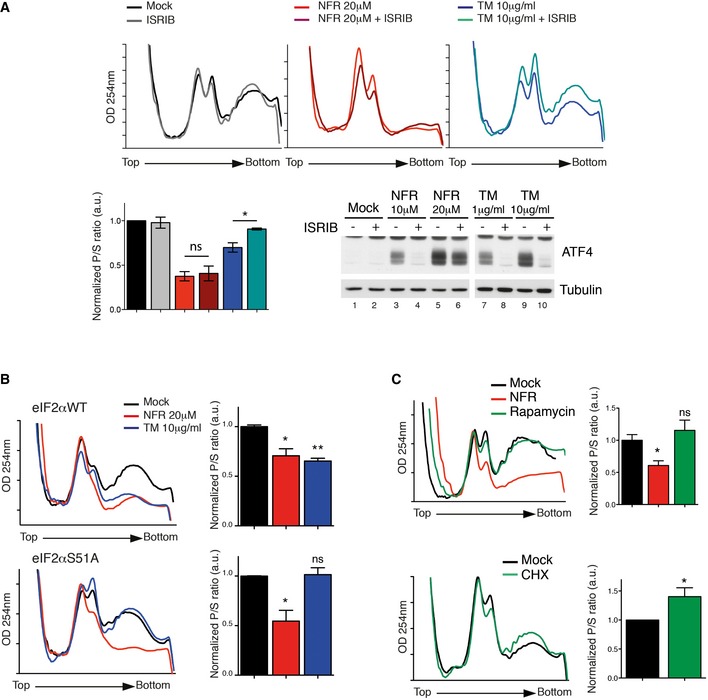
Figure EV4. NFR‐mediated changes in polysomal profile are not dependent on eIF2α phosphorylation.

-
ARepresentative polysome profiles of WT MEFs treated 6 h with NFR or TM with or without 500 nM ISRIB. Bar graph represents the ratio of sub‐polysomes compared with polysomes (P/S). OD254 nm is optical density at 254 nm. Data are mean ± s.e.m. of P/S ratio calculated from two independent experiments. P‐values were calculated using two‐tailed unpaired Student's t‐tests comparing ratio +/− ISRIB; *P‐value ≤ 0.05. ISRIB efficiency at inhibiting NFR‐ or TM‐mediated ATF4 induction was tested by immunoblot.
-
B, CRepresentative polysome profiles of eIF2αWT and eIF2αS51A MEFs treated 6 h with NFR or TM (B) or WT MEFs treated for 6 h with 20 μM NFR or 200 nM rapamycin (C, upper panel) or 30 min with 1 μg/ml CHX (C, lower panel). Data are mean ± s.e.m. of P/S ratio calculated from 2 to 3 independent experiments. P‐values were calculated using one‐way ANOVA followed by Bonferroni post‐test (B and C, upper panel) or two‐tailed unpaired Student's t‐test (C, lower panel); *P‐value ≤ 0.05, **P‐value ≤ 0.01.
