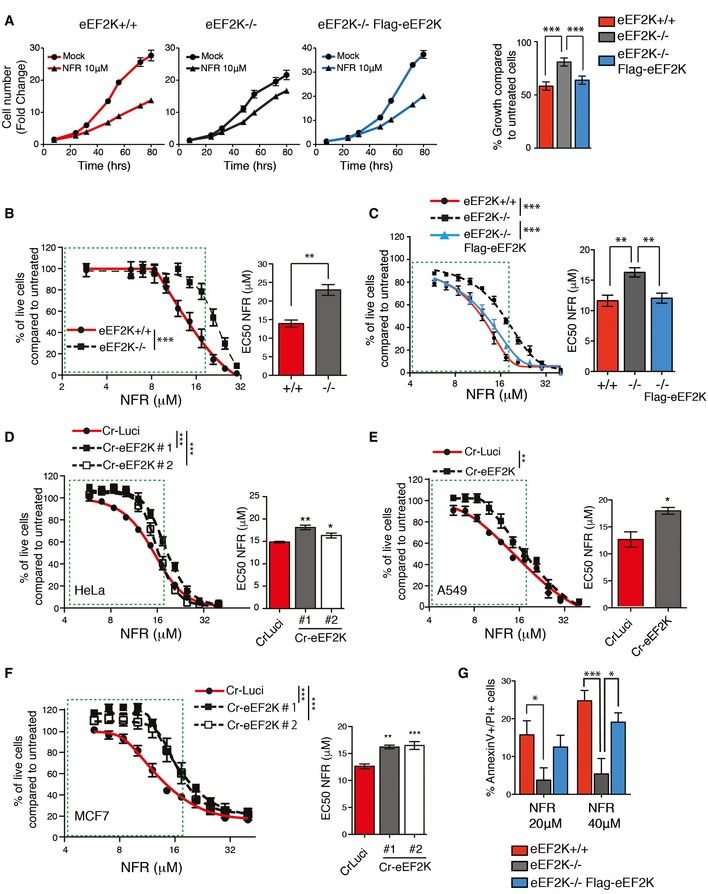
Figure 5. NFR‐mediated eEF2K activation impairs cell proliferation and triggers cell death.

-
AeEF2K WT, KO, or KO reconstituted with human eEF2K (Flag‐eEF2K) MEFs were analyzed for cell growth at the indicated times. Fold change (means ± s.e.m. of triplicate) of the cell number just before treatment are shown. Histogram shows percentage of growth inhibition after 72 h of 10 μM NFR. P‐values were calculated using one‐way ANOVA with Bonferroni post‐test calculated from three independent experiments. ***P‐value ≤ 0.001.
-
B–FDose–response curves for cell viability after 48 h of NFR treatment measured using the MTS assay. Curves and bar graphs for EC50 are mean ± s.e.m. of three independent experiments performed in triplicate. For curves, P‐values were calculated using two‐way ANOVA. For the bar graphs, P‐values were calculated using two‐tailed unpaired Student's t‐tests (B, E), one‐way ANOVA with Bonferroni (C), or Dunnett's multiple comparison post‐tests (D and F). *P‐value ≤ 0.05, **P‐value ≤ 0.01, ***P‐value ≤ 0.001. (B, C) eEF2K−/− MEFs show a decreased susceptibly to NFR compared to eEF2K+/+ controls (B) whereas eEF2K reconstitution restores NFR sensitivity (C). (D‐F) HeLa (D), A549 (E), and MCF7 (F) clones with CRISPR/Cas9‐generated eEF2K deficiency (Cr‐eEF2K) show a decreased susceptibility to NFR compared to control cells (CrLuci).
-
GNFR‐mediated toxicity assessed using AnnexinV–PI staining and FACS analysis after 24 h of treatment. Histogram shows the percentage of dead cells (AV+/PI+). Data are mean ± s.e.m. of three independent experiments. P‐values were calculated using two‐way ANOVA with Bonferroni post‐test. *P‐value ≤ 0.05, ***P‐value ≤ 0.001.
