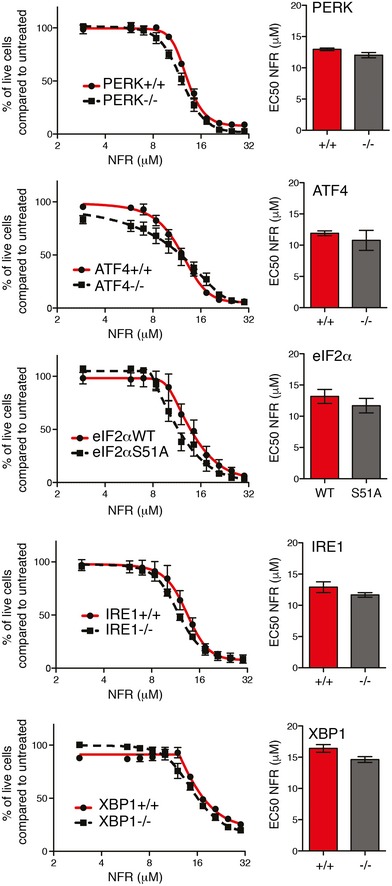
Figure EV5. UPR deficiency does not improve viability in the presence of NFR.

Dose–response curves for cell viability in MEFs unable to phosphorylate eIF2α (eIF2αS51A) or deficient for PERK, ATF4, IRE1, XBP1, and respective control cells treated with increasing doses of NFR for 48 h. Bar graph represents the EC50 (half‐maximal effective concentration) of the dose responses. Data are mean ± s.e.m. of three independent experiments performed in triplicate. Statistical significance was assessed using two‐way ANOVA for dose response and two‐tailed unpaired Student's t‐test for EC50. No significant differences were measured in the tested cell lines.
