
Figure 2. CITK controls mitotic spindle orientation in HeLa cells.
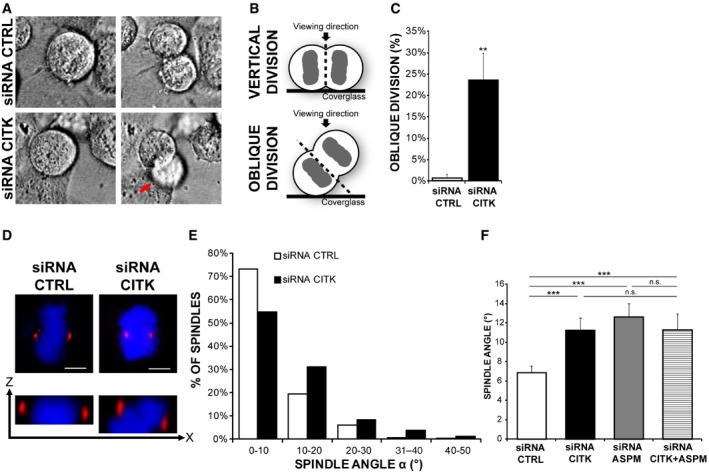
- Selected frames from time‐lapse imaging experiments (see Movies EV1 and EV2) showing two dividing cells transfected with either control (CTRL) or CITK‐specific siRNAs, respectively. Note one of the two daughter cells in the lower panel (red arrow) going out of focus as a consequence of oblique division.
- Graphical representation of vertical and oblique divisions. The cleavage plane is indicated by a black dashed line.
- Quantification of divisions showing uneven timing of daughter cell flattening onto the substrate after mitosis (oblique division) in CITK‐siRNA‐treated HeLa cells compared to control (n > 50 cells, three independent experiments).
- Control or CITK‐depleted cells were immunostained for γ‐tubulin (red) and DNA (blue) and imaged in z (0.3‐μm‐thick sections). Upper panel: maximum‐intensity projections of confocal z‐stacks are shown. Lower panel: cross section (XZ) through the two poles of the same cell. Scale bars, 5 μm.
- Distribution of spindle angles (°) in control and in CITK‐depleted cells. The values represent the angles between the axis crossing the two poles of metaphase spindles and the coverslip (n ≥ 150 cells, six independent experiments).
- Quantification of spindle angles average in control cells and in cells depleted of CITK or ASPM or codepleted of the two proteins (n ≥ 150 cells, in at least three independent experiments).