Fig. 2.

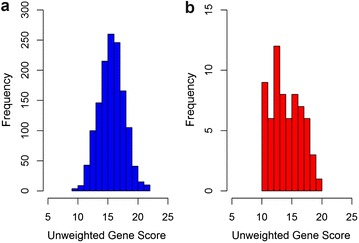
Distribution of risk alleles in a UK healthy men (n = 1360) and b CoRDia participants of Caucasian ethnicity in the SMI plus risk results arm (n = 66)*

Distribution of risk alleles in a UK healthy men (n = 1360) and b CoRDia participants of Caucasian ethnicity in the SMI plus risk results arm (n = 66)*