
Fig. 1.
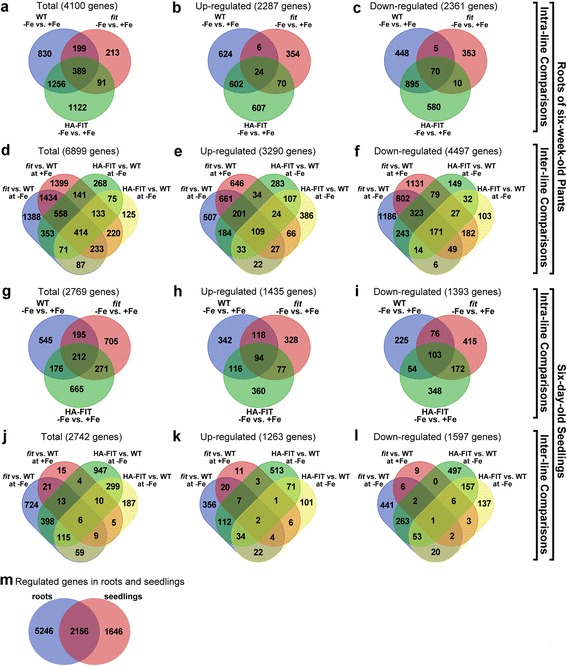
Venn diagrams of the differentially expressed genes in the six-week-old Arabidopsis roots (a-f) and six-day-old seedlings (g-l). Intra-line comparisons in roots (a-c): Total numbers of regulated genes (a), induced genes (b) and repressed genes (c). Inter-line comparisons in roots (d-f): Total numbers of regulated genes (d), induced genes (e) and repressed genes (f). Intra-line comparisons in seedlings (g-i): Total numbers of regulated genes (g), induced genes (h) and repressed genes (i). Inter-line comparisons in seedlings (j-l): Total numbers of regulated genes (j), induced genes (k) and repressed genes (l). Intersection between regulated genes in roots and seedlings (m). The diagrams were created using the unnamed online tool provided by VIB/U Gent, Bioinformatics & Systems Biology, Technologiepark 927, B-9052 Gent, Belgium; accessible through http://bioinformatics.psb.ugent.be/webtools/Venn/