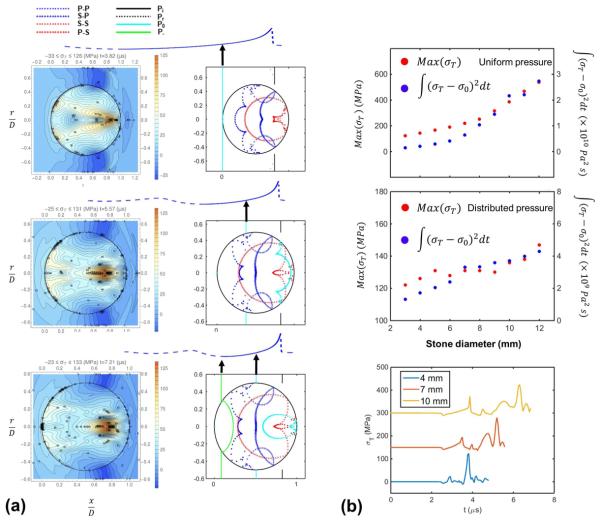
Figure 10.
(a) Tensile stress contours (left column, 5 MPa spacing) and corresponding ray- tracing plots (right column) in 4-, 7-, and 10-mm spherical stones during the S-S wave interaction. Note, P-P: longitudinal waves in stones generated by reflection of longitudinal waves, S-P: longitudinal waves in stones generated by reflection of transverse waves, S: transverse waves in stone, S-S: transverse waves generated by reflection of transverse waves, P-S: transverse waves generated by reflection of longitudinal waves, Pi: incident pressure wave in water, Pr: reflected pressure wave in water. Po: the wave front in the incident pressure wave in water with pressure equaling to zero. P-: the wave front in the incident pressure wave in water with maximum negative (tensile) pressure. (b) Variations of Peak tensile stress Max (σT) and tensile stress integral inside a spherical stone vs. stone diameter. The stones are subjected to an incident lithotripter pulse with either a uniform or a distributed pressure at the leading shock front, and (c) tensile stress signals detected by three sensors placed at the S-S interaction in the 4-, 7-, and 10-mm spherical stones, respectively. The sensor signals are displayed with different baseline shifts for clarity of comparison.

