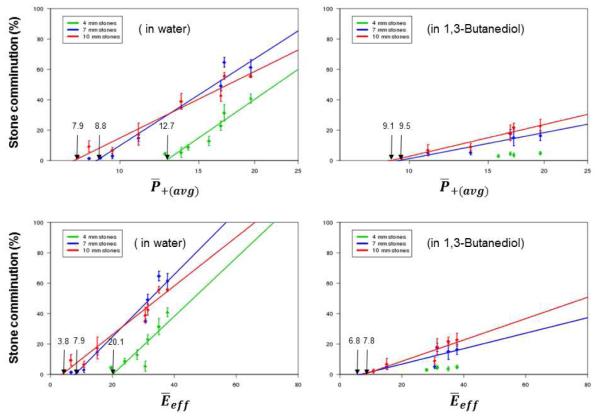
Figure 3.
Correlation between stone comminution and and in water and 1,3- butanediol after 1000 shocks for three size groups: 4 mm (green), 7 mm (blue) and 10 mm (red). The and thresholds for each size group are indicated by arrows. Note and and normalized P+(avg) and Eeff, respectively. Four samples were used under each specific test condition and at each location in the lithotripter field.

