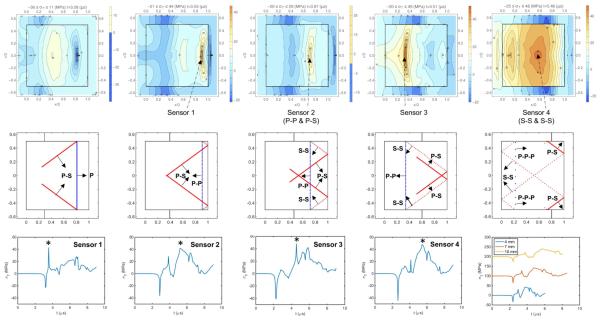
Figure 8.
Wave propagation and interaction in a 7-mm cylindrical BegoStone phantom. Top row: tensile stress contours at 5 MPa spacing. Second row: ray-tracing plots at corresponding times of the tensile stress contour plots. Third row: tensile stress signal detected by four sensors placed at different locations inside the stone (* is used to mark the peak in each sensor signal) together with the tensile stress signals detected by three sensors placed at the P-P and P-S interaction point in 4-, 7-, and 10-mm cylindrical stones, respectively. The sensor signals are displayed with different baseline shifts for clarity of comparison.

