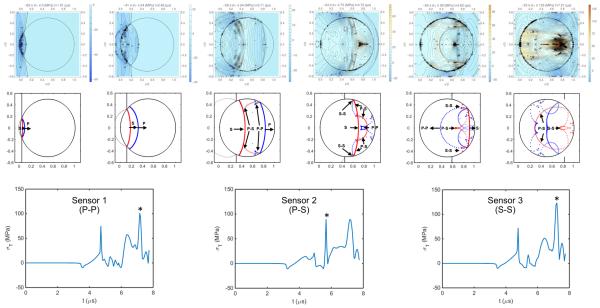
Figure 9.
Tensile stress contours (top row) and corresponding ray-tracing plots (second row) at six different times in a 10-mm spherical stone subjected to a weakly focused incident lithotripter pulse: (1) 1.91 µs, wavefronts of P and S waves attached, (2) 2.49 µs, wavefronts of P and S waves detached from each other, (3) 3.71 µs, high tensile stress generation at the boundary, (4) 4.72 µs, during P-P wave interaction, (5) 5.62 µs, during P-S wave interaction, and (6) 7.21 µs, during S-S wave interaction. In the tensile stress contours, 5 MPa spacing is used between contour lines at t = 1.91 and 2.49 µs, while 2 MPa spacing is used elsewhere. Third row: tensile stress signal from three sensors placed at the locations of the maximum P-P wave interaction, P-S wave interaction, and S-S wave interaction, respectively.

