Figure 1.
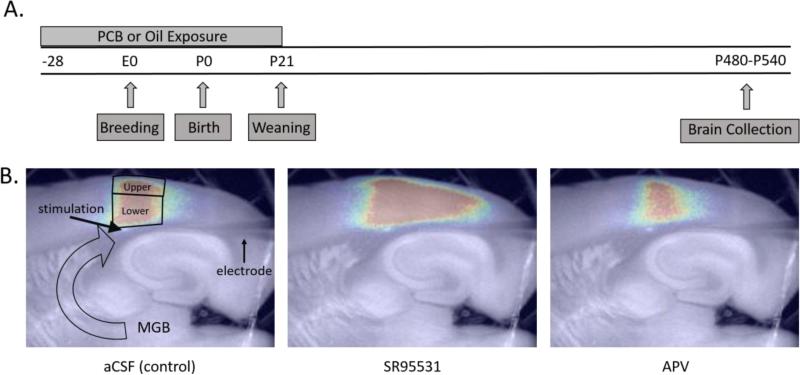
A) Timeline of experimental procedures B) Representative pictures of activation (200 μA) of the auditory cortex (AC) under aCSF (artificial cerebral spinal fluid), SR95531, and AP5 conditions. Outlined areas show the regions of interest for analyses of activation and redox ratios in response to stimulation of thalamocortical fibers. −28 = 28 days prior to breeding, E = embryonic day, P = postnatal day, MGB = medial geniculate body of the thalamus, large open arrow = thalamocortical fibers, upper = upper layers, lower = lower layers

