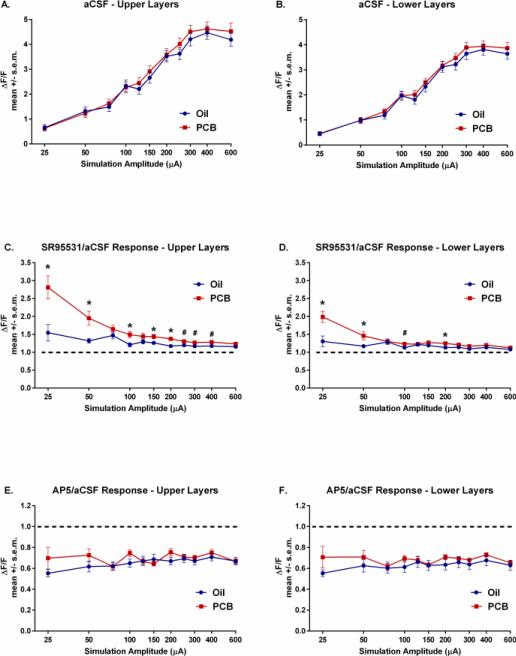
Figure 2.
A) Autofluorescence (ΔF/F) in the upper layers of the AC in the aCSF condition. B) Autofluorescence of the AC in the lower layers in the aCSF condition. C) Ratio of change in autofluorescence in SR95531/aCSF conditions in the upper layers. D) Ratio of change in autofluorescence in SR95531/aCSF conditions in the lowers layers. E) Ratio of change in autofluorescence in AP5/aCSF conditions in the upper layers. F) Ratio of change in autofluorescence in AP5/aCSF conditions in the lower layers. *significant difference in activation between slices of oil and PCB-exposed animals (p<.05). dashed line = 1:1 ratio of SR95531 or AP5:aCSF condition

