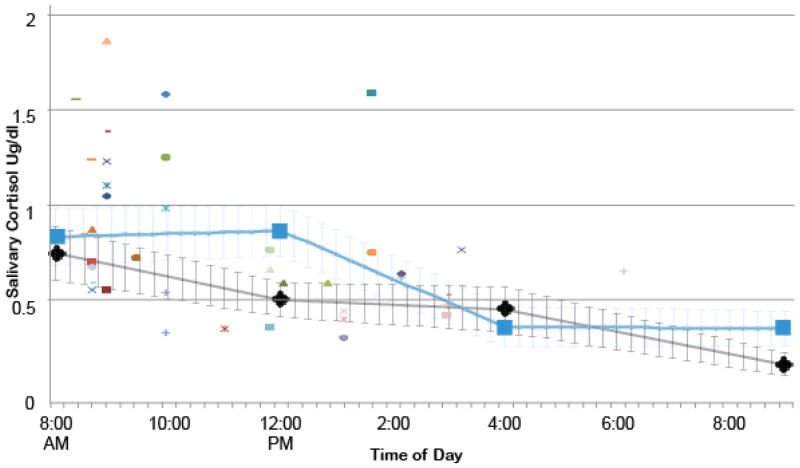
Figure 1.
Pre-scan cortisol (raw values) in NMD participants plotted individually against estimated trend lines of diurnal cortisol averages on a non-scan day in 1) HC participants (grey) and 2) MDD participants (blue). Note that no BP patients had cortisol available for this trendline.
*For interpretation of the references to color in this figure legend, the reader is referred to the web version of the article

