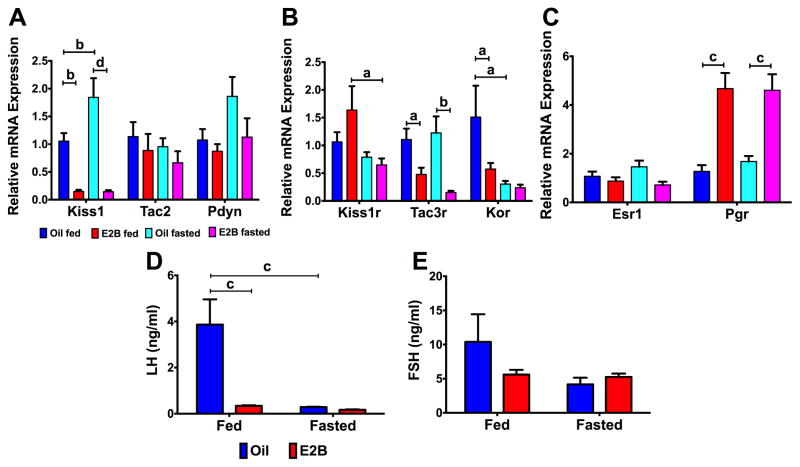
Figure 2. Fasting (24 h) regulates KNDy-associated gene expression in the ARC (Experiment #1).
(A) KNDy genes: Kiss1, Tac2, and Pdyn; (B) KNDy-associated receptors: Kiss1r, Tac3r, and Kor; and (C) steroid hormone receptors: Esr1 and Pgr. D) Plasma LH levels and (E) Plasma FSH levels. For all, n = 5 – 6. Gene expression data were normalized to oil fed controls for each gene. All data were analyzed using a two-way ANOVA (fasting x steroid) followed by post-hoc Newman-Keuls analysis (a = p < 0.05; b = p < 0.01; c = p < 0.001; d = p < 0.0001).

