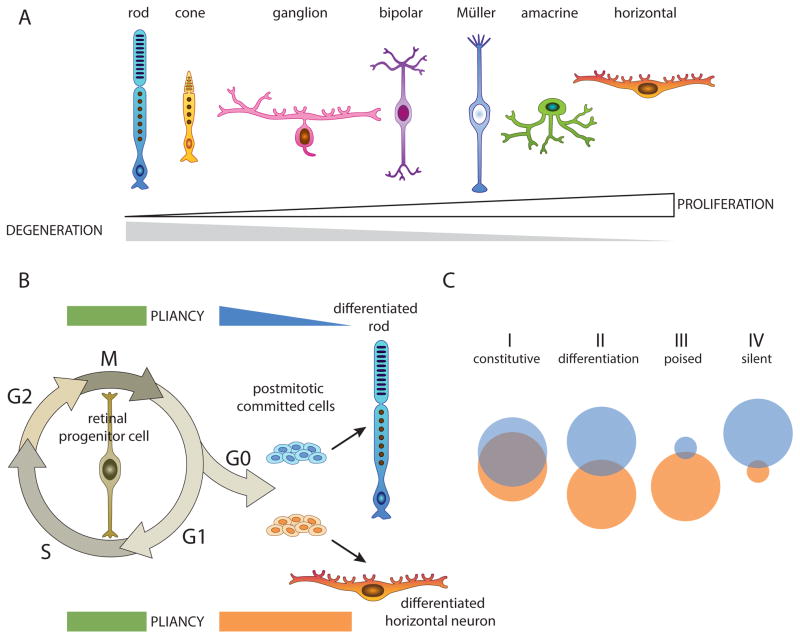
Figure 3. Cellular Pliancy Model.
A) The 7 major classes of cell types in the retina are lined up along a continuum based on their susceptibility to cell death and degeneration (gray) or proliferation and malignant transformation (white). B) Diagram of the cellular pliancy during development of rod photoreceptors and horizontal neurons: Proliferating retinal progenitor cells are highly pliant and their genomes are organized in a more open epigenetic configuration. As cells exit the cell cycle and differentiate, they activate a cell-type specific pliancy program that is cell type specific and interconnected with the differentiation program. C) Some genes are constitutively expressed (group I) in rods and horizontal cells and in an open chromatin configuration. Some genes are expressed only in rods (blue circle) or horizontal cells (orange circle) with little overlap (group II). The organization of genes that are not normally expressed into poised (group III) or epigenetically silent (group IV) domains of the genome contributes to cellular pliancy. If a stress response gene is in a poised state, it can be turned on and protect the cell from injury. If it is in a silent state, the cell will be more prone to cell death and degeneration.

