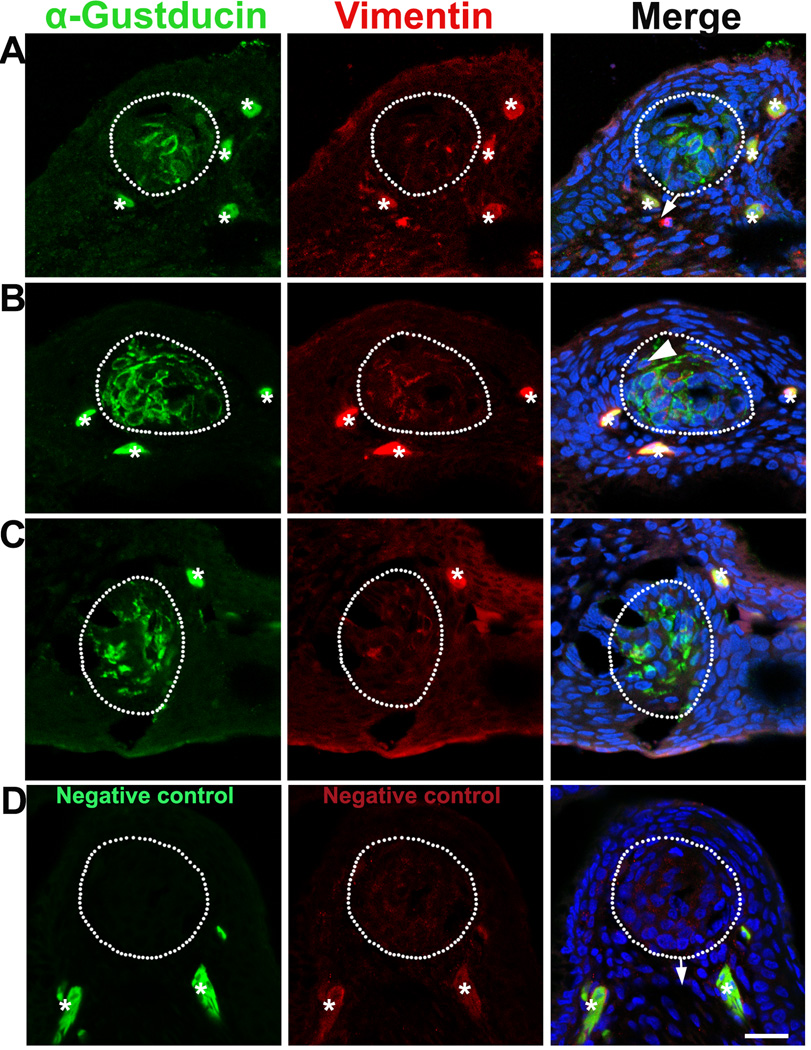
Fig. 1.
Single plane laser-scanning confocal photomicrographs illustrate the distribution of α-Gustducin (green) and Vimentin (red) immunosignals in the oral tissue of chicken at E18 (A) and E19 (B–C) in the base of the oral cavity (A, B) and palate (C). Sections of the base of the oral cavity reacted without adding primary antibodies were used as negative controls (D, E19). Sections were counterstained with DAPI (blue) to stain cell nuclei. White dots outline the specified cell clusters where taste buds develop. Arrows point to the connective tissue. Arrowhead in B point to a cell double labeled with both α-Gustducin and Vimentin. Asterisks mark non-specifically labeled cells. Scale bars: 20 µm for all images

