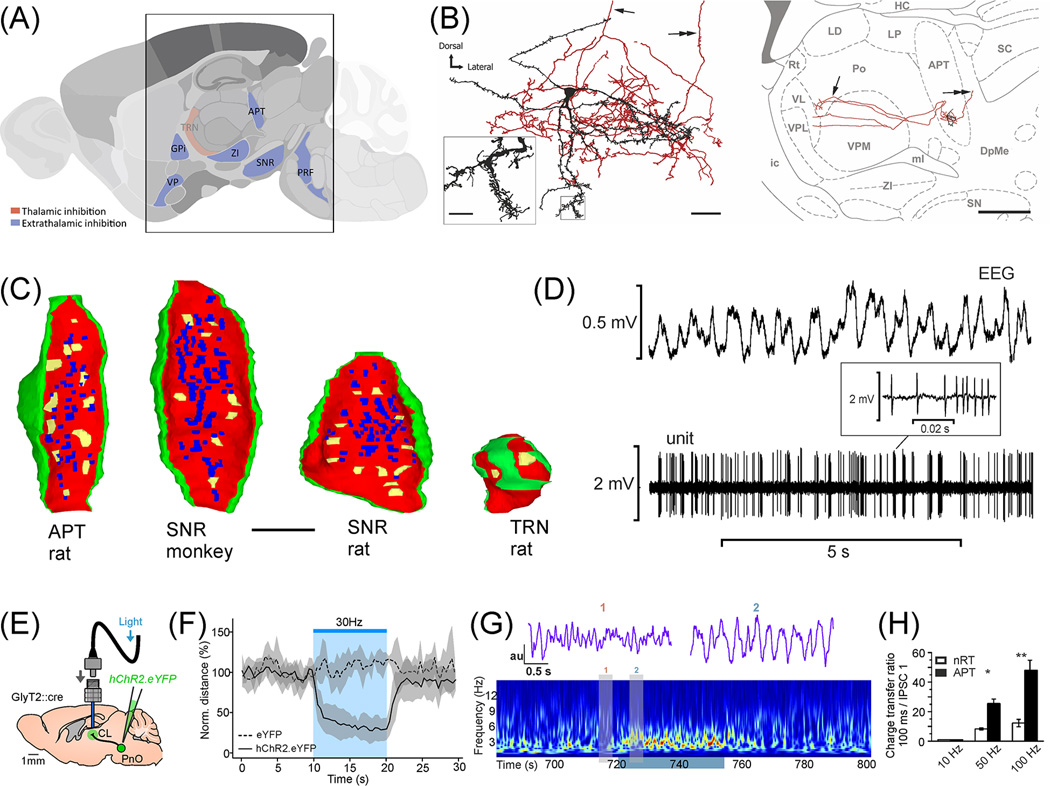
Figure 3.
Extrathalamic inhibition in the thalamus A) Parasagittal section of the brain highlighting the position of ETI nuclei (blue) around the thalamus. B) An ETI neuron in the APT. The cell have spiny dendrites, profuse local axon collaterals (left) and two ascending main axons ramifying in n.posterior of the thalamus (arrow, right). The cell also display a descending main axon (double arrow). C) Comparison of ETI and TRN terminals on the same scale. 3D reconstructions from serial electron microscopic sections. Yellow, active zones; blue, puncta adhaerentia; red, membrane of the terminal; green, glia. All active zones of ETI terminals converge on the same TC cell. Almost all TRN terminals have a single active zone per target. If they form two (arrows on the right) synapses they are separated by glia and innervate different dendrites. Note the similarity of ETI terminals among structures and taxa D) Firing activity of an APT cell in vivo with concurrent EEG recording. Note high frequency action potential clusters (inset). E–G) Activation of ETI terminals originating from PRF in the intralaminar nucleus leads to the disruption of all ongoing behavior and global alteration of the EEG activity. E) Experimental arrangement. F) Normalized travelled distance, before, during and after the stimulation. G) Wavelet spectrum of the cortical LFP. Warm color depicts higher power. Grey bars indicate the time of raw cortical LFP shown above. H) Difference in charge transfer during high frequency stimulation between ETI (APT) and TRN terminals. ETI transmission is stable at high presynaptic firing rates as well. Figures B, D from [13], C from [15,14], E–G from [16] and H from [15].

