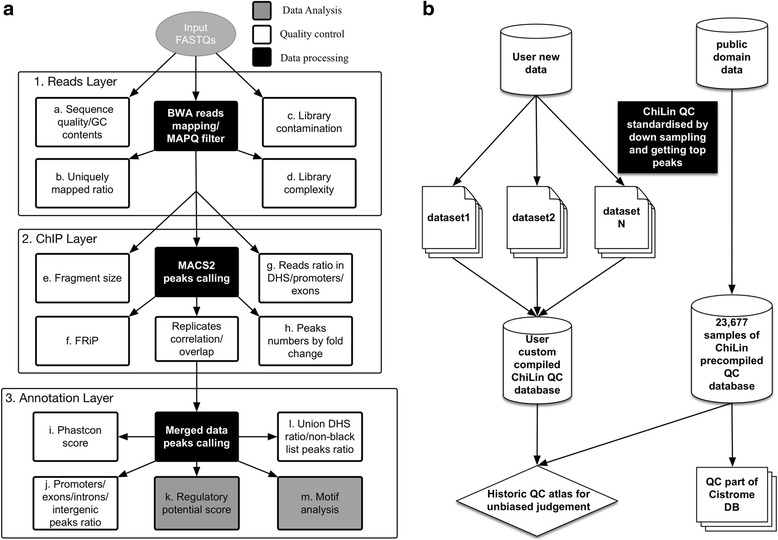
Fig. 1.

Workflow of ChiLin and quality report. a Arrows show the dependency relationship and order of the steps. Data processing steps are indicated in black and quality control steps are indicated in white. b batch mode processing of datasets for user to customize internal QC database, post-processing script for compiling QC database is provided at https://github.com/cfce/chilin/blob/master/demo/compile_database.sh
