Fig. 1.

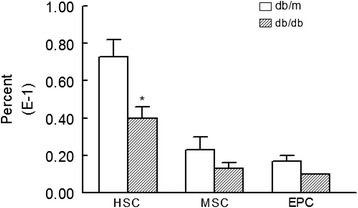
Bar graphs show levels of HSCs (Sca1+cKit+CD31−), MSCs (Sca1+CD105+CD31−), and EPCs (Sca1+ckit+CD31+) in peripheral blood of db/db and db/m mice. *p < 0.05 compared to the db/m group

Bar graphs show levels of HSCs (Sca1+cKit+CD31−), MSCs (Sca1+CD105+CD31−), and EPCs (Sca1+ckit+CD31+) in peripheral blood of db/db and db/m mice. *p < 0.05 compared to the db/m group