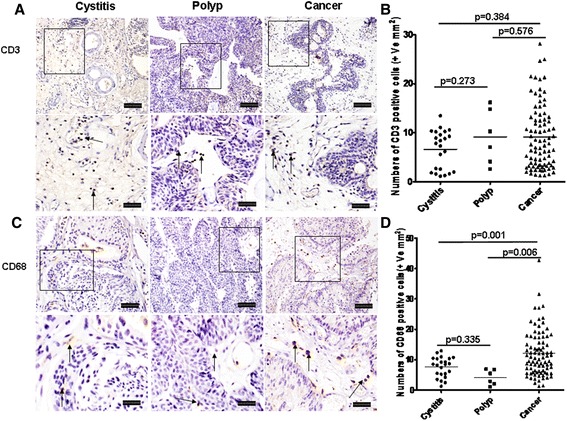
Fig. 4.

Infiltration T cells and macrophages in cystitis, polyp and bladder cancer tissues. a and c Representative photomicrographs of CD3+ T cells and CD68+ macrophages in bladder sections from subjects with cystitis (n = 23), polyp (n = 6) and bladder cancer (n = 80) (original magnification × 10 and 20). b and d Quantitative analysis of numbers of CD3+ T cells and CD68+ macrophages per unit area of bladder sections. Data are expressed as the mean ± SEM. Arrows show examples of positively stained cells. The scale bar means 100 μm
