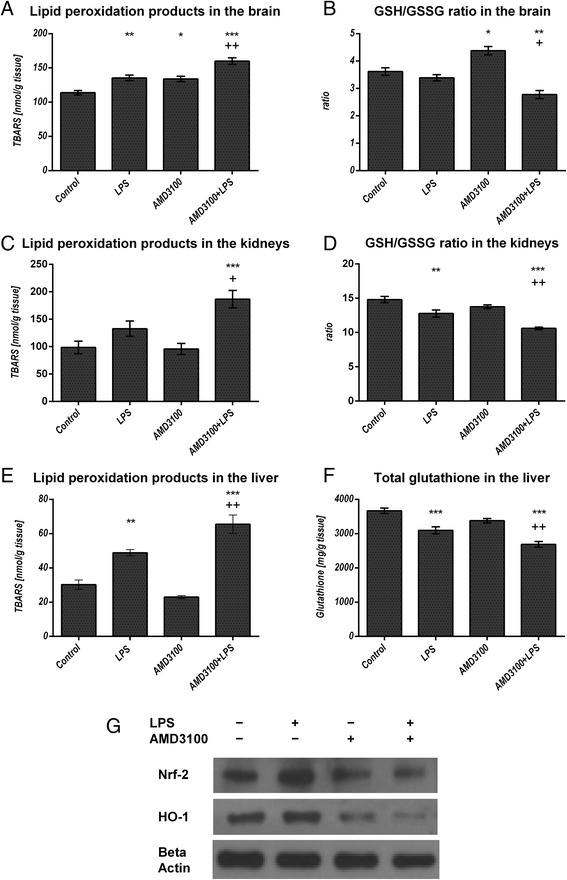
Fig. 3.

Oxidative stress in different organs. C57BL/6 N mice were treated either with LPS (5 mg/kg body weight), AMD3100 (5 mg/kg body weight), with both substances or with the solvent PBS (control). 24 h after LPS administration, the mice were sacrificed and different organs were collected for the analysis of the tissue content of lipid peroxidation products as determined by thiobarbituric acid reactive substances (TBARS) (a, c, e). As additional parameters, the GSH/GSSG ratio in the brain and kidneys (b, d) and the total glutathione content in the liver (f) are depicted. Data are given as mean ± standard error of the mean (SEM), n = 7 for each group. Statistical significant differences between the different treatment groups were determined by using the one-way analysis of variance (ANOVA) and the Tukey post hoc test and are indicated as follows: *, p < 0.05; **, p < 0.01; ***, p < 0.001 vs. control animals; +, p < 0.05; ++, p < 0.01; +++, p < 0.001 vs. LPS treatment. In (g) representative examples of n = 4 independent immunoblot analyses of Nrf-2 and HO-1 expression in the liver are shown
