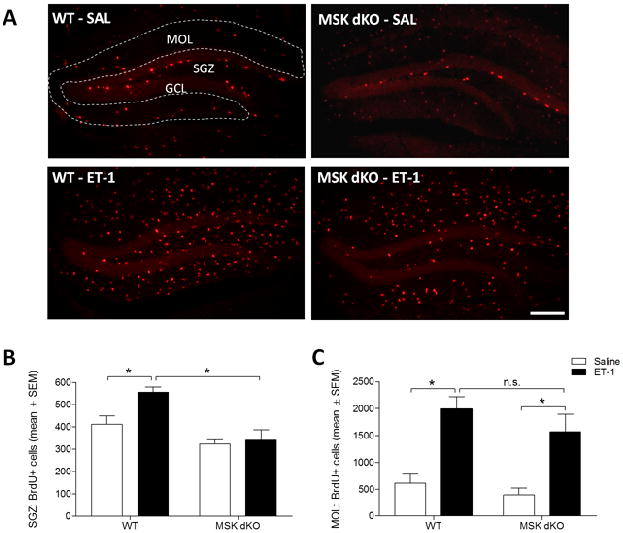
Figure 2. Ischemia-induced progenitor cell proliferation.
Two days following ET-1 infusion, mice were injected with BrdU and sacrificed. A) Representative images of BrdU-labeled dentate gyrus. B) Quantitative analysis revealed that the number of BrdU-labeled cells in the SGZ is increased following ischemia in WT but not MSK dKO mice (F3,18 = 11.374, p < 0.05). C) The number of BrdU-positive cells in the molecular layer (MOL) is increased following ET-1 ischemia in both WT and MSK dKO mice (F3,18 = 10.189, p < 0.05). Scale bar = 200μm. Data are presented as mean ± SEM. An asterisk (*) denotes a statistically significant difference between groups.

