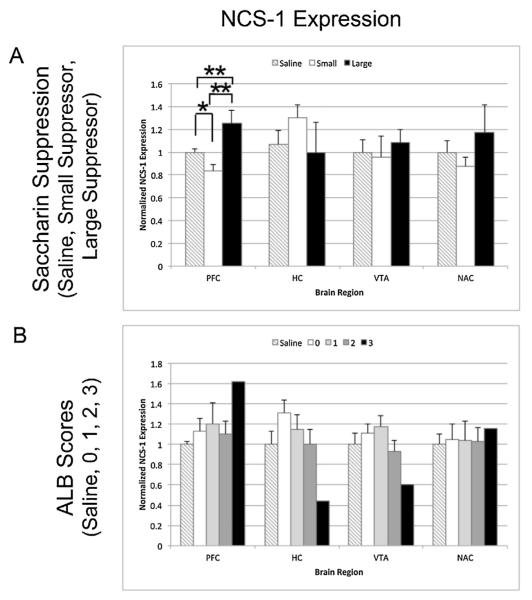
Fig. 7.
NCS-1 protein expression in heroin self-administering rats in the prefrontal cortex (PFC), hippocampus (HC), ventral tegmental area (VTA) and nucleus accumbens (NAc). Bar graphs represent normalized band intensities across three Western blots for each individual rat averaged within behavioral categories. (A) Normalized NCS-1 (±SEM) expression for saline animals (n = 7), largest saccharin suppressors (n = 5), and smallest saccharin suppressors (n = 5) (B). Normalized NCS-1 expression (±SEM) for into saline animals (n = 7) and ALB scores of 0 (n = 11), 1 (n = 9), 2 (n = 10), and 3 (n = 1). *p < 0.05 and **p < 0.01.

