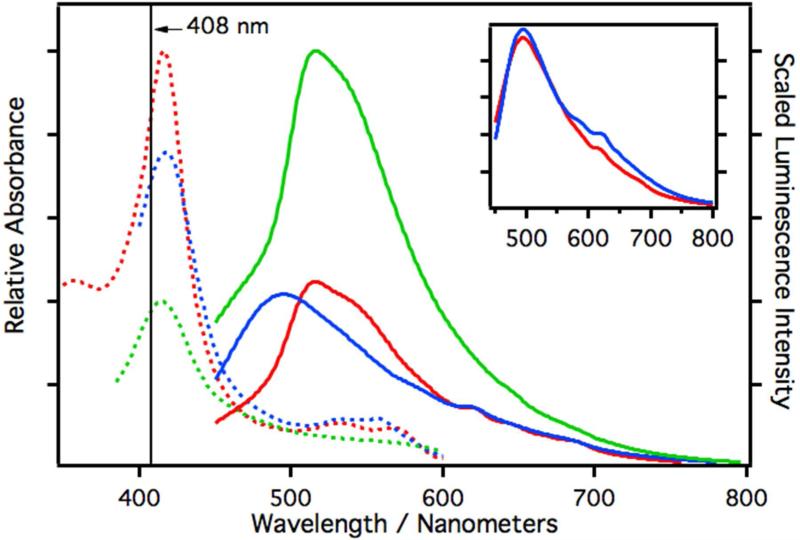
Figure 4.
Relative absorption and scaled luminescence spectra of CYP2C9 in phosphate buffer (3.5 μM). The luminescence spectra are scaled with respect to their measured relative quantum yields. The dashed curves are the absorption spectra and the solid curves are the luminescence spectra. The red curves are spectra of native CYP2C9, the blue curves are spectra of samples reduced with a small amount of dithionite, and the green curves are spectra of samples treated with CuOOH. All luminescence spectra were excited at 408 nm. The inset is an overlay of the scaled luminescence spectra of reduced CYP3A4 (red) and reduced CYP2C9 (blue).

