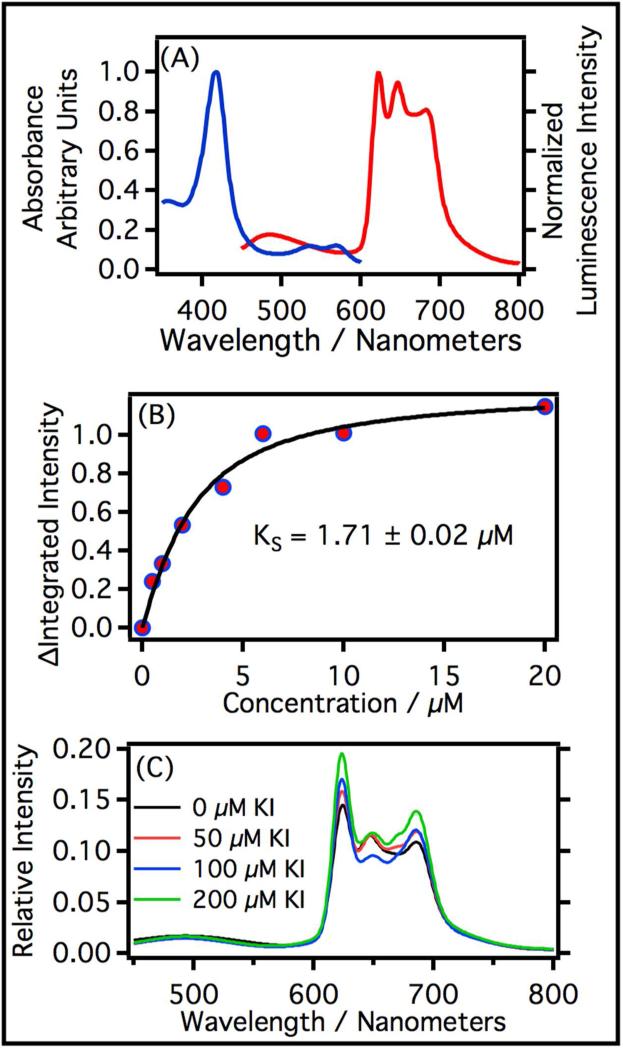
Figure 9.
(a) Absorption and luminescence spectra of P450cam in phosphate buffer (30.1 μM). The blue curve is the absorption spectrum. The red curve is the luminescence spectrum of P450cam excited at 408 nm. (b) Spectroscopic titration curve of P450cam with camphor. The black line is a fit of the data using the equation given in section 2.9. (c) Heavy element effect on phosphorescence. Spectra of P450cam at increasing concentrations of KI (0 μM, 50 μM, 100 μM, and 200 μM).

