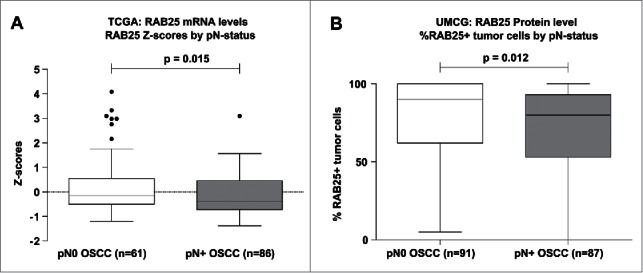
Figure 3.

RAB25 expression levels between pN0 and pN+ OSCC in the UMCG and TCGA OSCC cohort. (A) pN+ OSCC in the TCGA cohort (n = 86) express significantly less RAB25 mRNA than pN0 OSCC (n = 61), as revealed by Mann-Whitney-U test. (B) pN + OSCC in the UMCG cohort (n = 87) have significantly less RAB25-positive tumor cells than pN0 OSCC (n = 91), as revealed by Mann-Whitney-U test.
