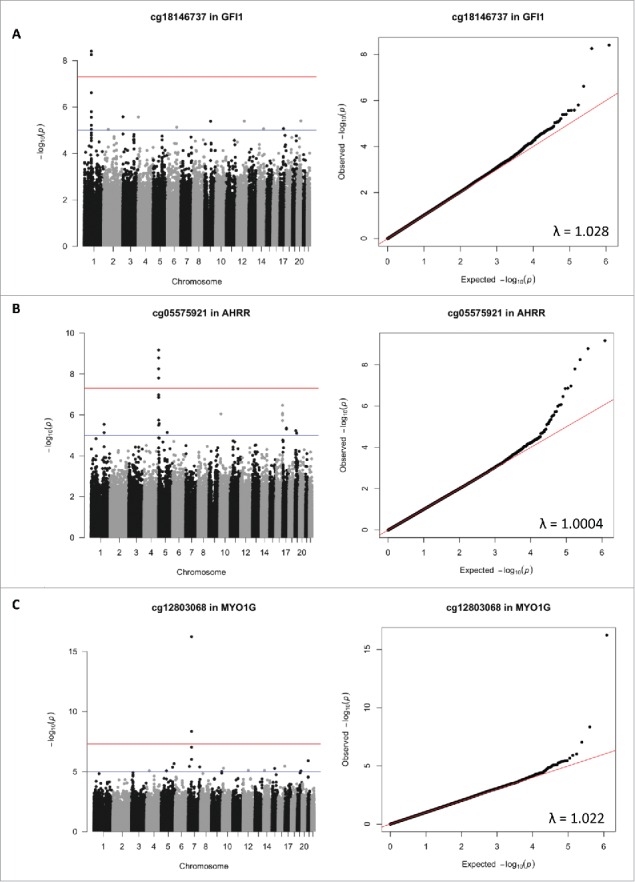
Figure 1.

Manhattan and quantile-quantile plots (QQ-plots) of the results of genome-wide associations tests looking at genome-wide associations between 3 candidate CpG sites sensitive to smoking [cg18146737 in the GFI1 gene on the chromosome 1 (panel A), cg05575921 in the AHRR gene on the chromosome 5 (panel B), and cg12803068 in the MYO1G gene on the chromosome 7 (panel C)] and genotype at 606,588 SNPs throughout the genome in 736 participants of the California Childhood Leukemia Study. The genomic inflation estimation factors lambda are reported on the plots. On the Manhattan plots, the red line corresponds to the canonical threshold of genome-wide significance [-log10(5 × 10−08)], and the blue line represents suggestive significance [-log10(10−05)].
