Figure 2.
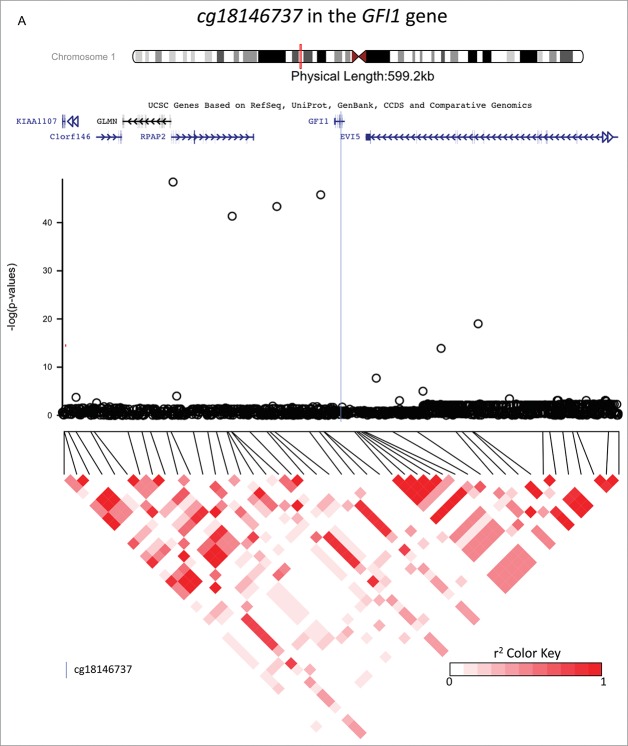
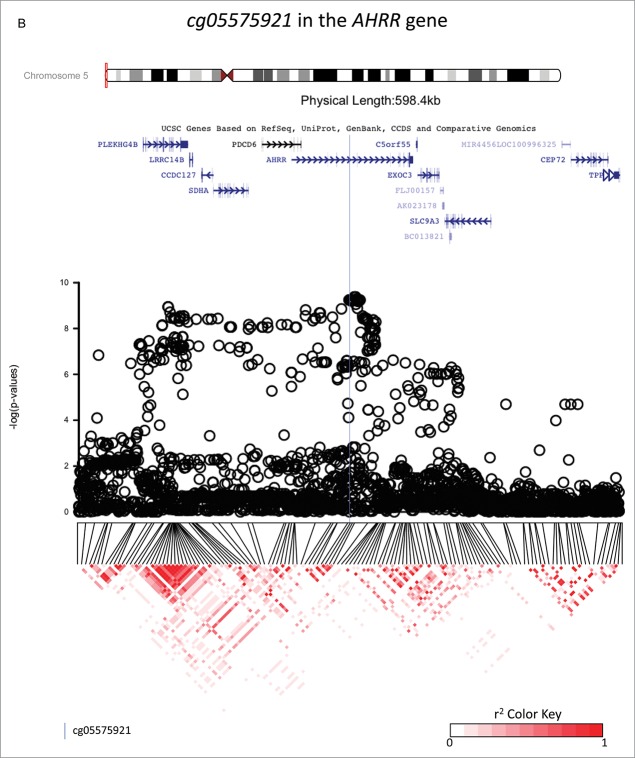
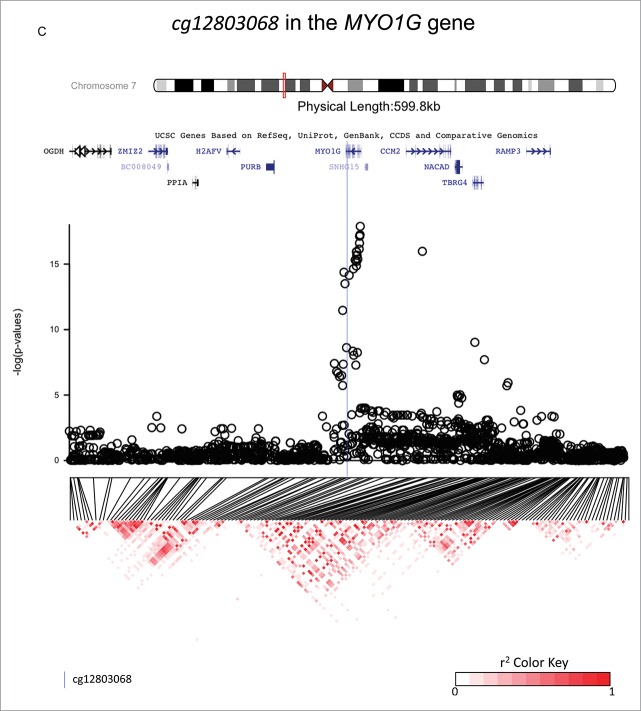
Investigations of a ± 300 kb region around 3 CpG sites of interest (cg18146737, cg05575921, and cg12803068) for fine-mapping using imputed SNP data in 736 participants of the California Childhood Leukemia Study. The plots represent the P-values of the associations between DNA methylation at the CpG site of interest and genotype at the SNPs in the region. Canonical transcripts of the neighboring genes in the region are displayed based on the University of California, Santa Cruz Genome Browser data (hg19).26 Linkage disequilibrium plots are represented below (r2 values) for SNPs that were genotyped on array. The blue line is located at the location of the CpG site of interest.
Figure 2.
(Continued).
Figure 2.
(Continued).


