
Figure 5.
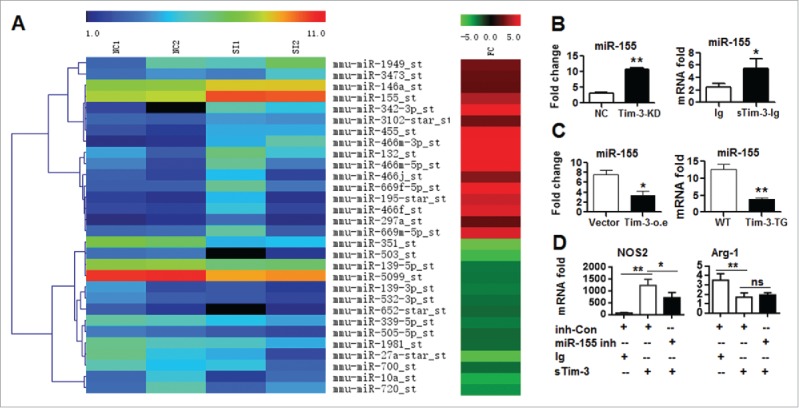
mi-R155 is involved in Tim-3-induced macrophage polarization. (A) Microarray data showing microRNAs differentially expressed in control RAW264.7 cells (NC1 and NC2) or RAW264.7 cells with stable knockdown of Tim-3 (SI1 and SI2) (left column) and the fold change (FC) in the knockdown sample compared to the control sample (right column). (B and C) miR-155 levels measured by real-time PCR in RAW264.7 cells with stable knockdown of Tim-3 and controls (B, left panel), RAW264.7 cells treated with 10 μg/mL of sTim-3-Ig or Ig (B, right panel), RAW264.7 cells stably overexpressing Tim-3 or controls (C, left), or peritoneal macrophages isolated from wild type or Tim-3-TG mice (C, right). (D) RAW264.7 cells transfected with miR-155 inhibitor (miR-155 inh) or inhibitor control (inh-Con) were incubated with Ig or sTim-3-Ig (10 μg/mL) for 10 h, then NOS2 (left panel) and Arg-1 (right panel) mRNA levels were measured by real-time PCR. In B–D, the data are representative of those obtained in three independent experiments, each performed in triplicate. ns: no significance; *p < 0.05, **p < 0.01.