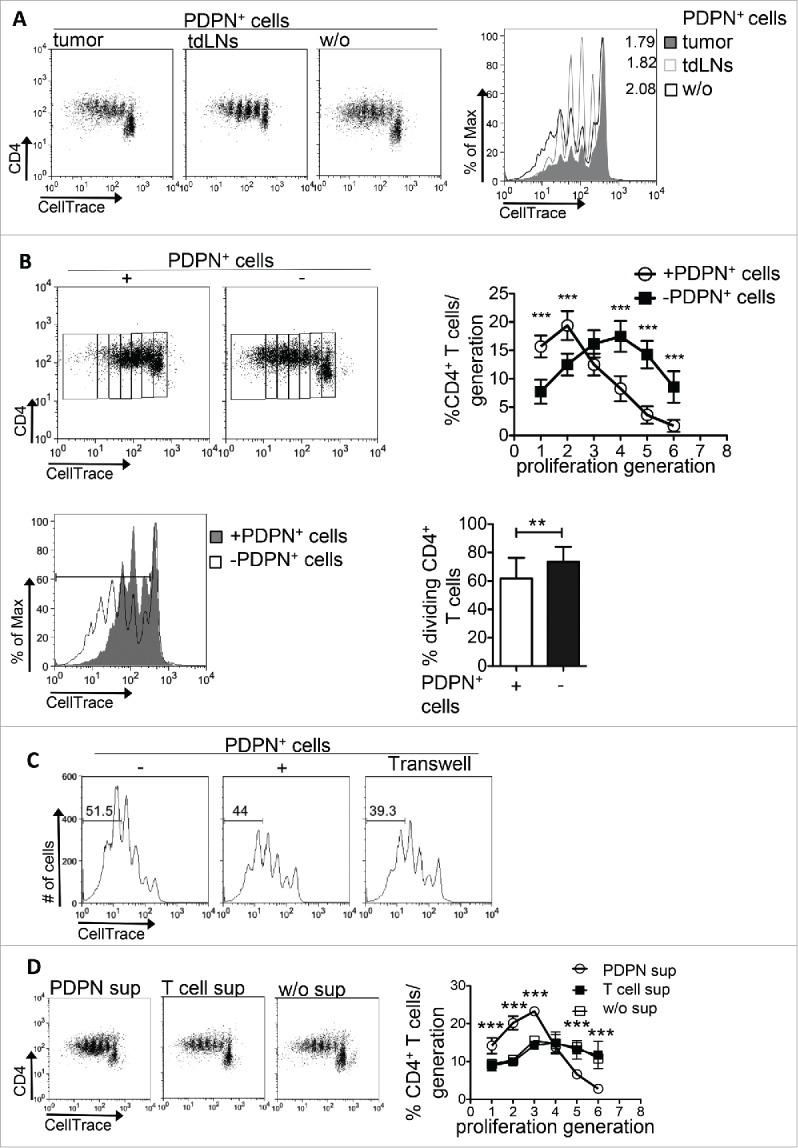
Figure 2.

PDPN+ LNSCs inhibit CD4+ T cell proliferation in vitro. (A) CellTrace-labeled CD4+CD25−CD69−CD11c− (15 × 104) T cells sorted from splenocytes of naive C57BL/6 mice were activated with aCD3 (0.2 μg/mL) and IL-2 (20 ng/mL) for 3.5 d in the presence or absence of PDPN+ LNSCs (5 × 10⁴) sorted from tumors and tdLNs on day 14 after tumor inoculation. (B) T cells isolated and activated as in A were co-cultured with PDPN+ LNSCs sorted from naive mice. (C) PDPN+ LNSCs were separated from T cells using a 0.4 μm transwell insert. Proliferation was assessed by flow cytometry based on CellTrace dilution. Graphs denote the mean percentages and standard deviations of CD4+ T cells in each proliferation generation and of dividing CD4+ T cells. (D) Mean and standard deviation of the percentage of CD4+ T cells per generation of proliferation in cultures of CellTrace-labeled CD4+CD25−CD69−CD11c− (15 × 104) T cells with aCD3 (0.2 μg/mL) and IL-2 (20 ng/mL) in the absence (w/o sup) or presence of 3.5 d supernatants from co-cultures of PDPN+ LNSCs with CD4+ T cells (PDPN sup) or from cultures of CD4+ T cells alone (T cell sup) are presented. Means have been calculated from 15 to 19 independent experiments. Numbers on FACS plots denote frequency of gated population or proliferation index (p.i.). **p < 0.005, ***p < 0.0005.
