Figure 3.
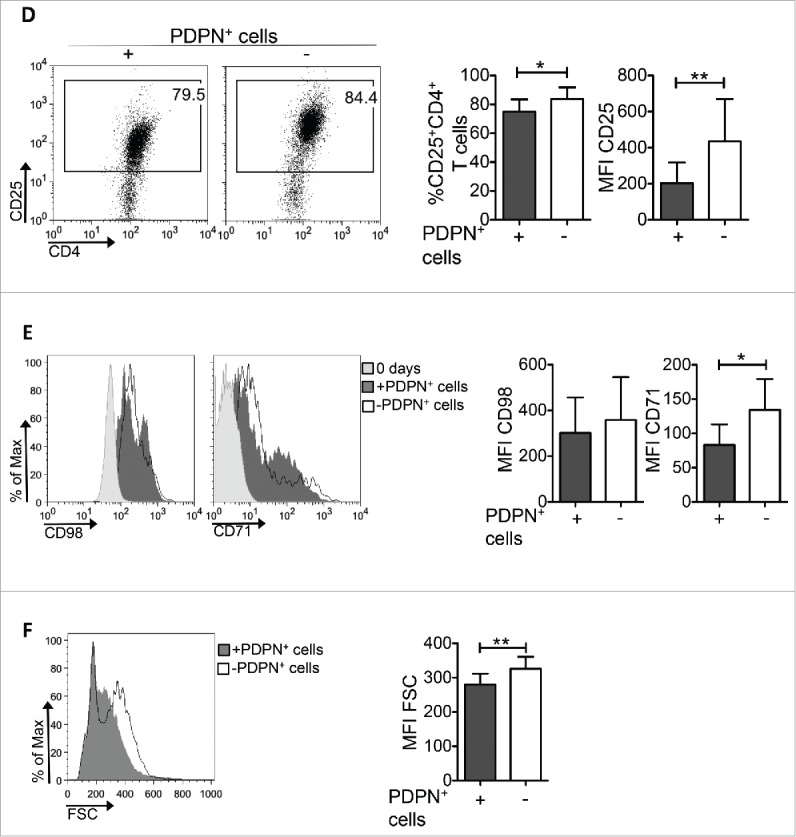
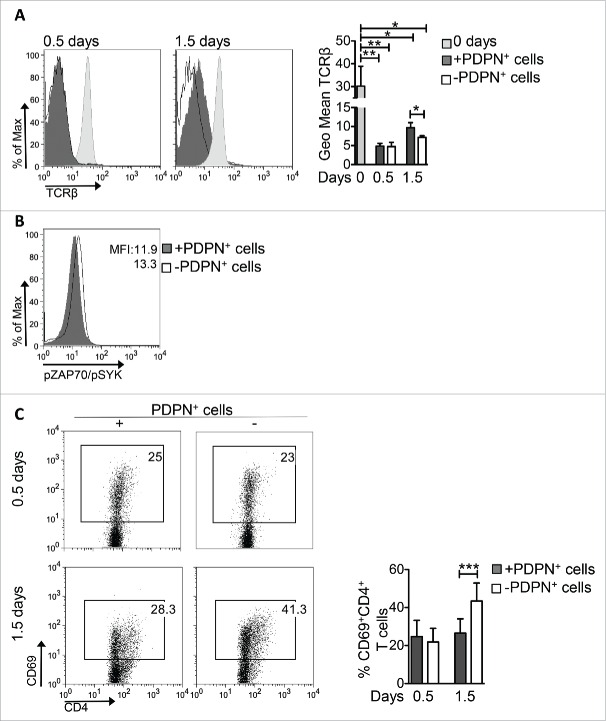
PDPN+ LNSCs impair TCR signaling, CD4+ T cell activation and growth. CD4+CD25−CD69−CD11c− (15 × 104) T cells sorted from splenocytes of naive C57BL/6 mice were activated with aCD3 (0.2 μg/mL) and IL-2 (20 ng/mL) in the presence or absence of PDPN+ LNSCs (5 × 10⁴) sorted from LNs of naive mice. (A) Geometric mean (Geo Mean) and standard deviation of TCRβ surface expression on days 0.5 and 1.5 are shown. (B) Histogram represents phosphorylation of ZAP70 and SYK(Y319/Y352) on day 0.5. (C) Mean and standard deviation of the percentage of CD69+CD4+ T cells on days 0.5 and 1.5 are presented. (D) On day 3.5 mean and standard deviation of the percentage of CD25+CD4+ T cells and of CD25 mean fluorescent intensity (MFI) were calculated and are denoted. (E) MFI and standard deviation of CD98 and CD71 cell surface expression on CD4+CD69+ T cells on day 0 and 1.5 are shown. (F) Histogram and graph represent the MFI of forward side scatter (FSC) of CD4+ T cells 3.5 d after the initiation of the culture. Means and standard deviation were calculated from 4 (A, B, E) and 20 (C, D, F) replicates. Numbers on FACS plots denote frequency of gated population. *p < 0.05, **p < 0.005, ***p < 0.0005.
Figure 3.

(Continued)

